Performance dashboard LCA & material results & interpretation How we make it greener SM Transparency Catalog Knauf Insulation Showroom Earthwool® Insulation Board Earthwool® Insulation Board Unfaced, ASJ+, FSK Knauf Insulation Earthwool® Insulation Board is a versatile product for thermal and acoustical applications such as heating and air conditioning ducts, power and process equipment, boiler and stack installation, and more. It is bonded with ECOSE® Technology and is available plain or with a factory applied foil-scrim-kraft (FSK) facing or all service jacket (ASJ+) facing. Performance dashboard Features & functionality Environment & materials Excellent thermal efficiency results in lower Improved by: operating costs Utilization of recycled glass FSK and ASJ+ vapor-retardant facings provide Knauf’s original bio-based ECOSE® Technology binder a neat finished appearance in mechanical technology rooms Certification & rating systems: Low emitting and formaldehyde-free for indoor air quality considerations HPD v2.2 (Unfaced), v2.3 (ASJ+ and FSK) Excellent acoustical properties effectively UL GREENGUARD Gold certified reduce noise UL Validated recycled content UL Validated formaldehyde-free Visit Knauf for more product information Audited, European Certification Board for Mineral Earthwool® Insulation Board unfaced Wool Products exoneration process Earthwool® Insulation Board FSK-faced ASTM C612: Type IA (1.6, 2.25, 3.0, 4.25, 6.0 pcf), Type Earthwool® Insulation Board ASJ+-faced IB (3.0, 4.25, 6.0 pcf); ASTM C795; ASTM C1136: Type I, II, III, IV, VIII (ASJ+), Type II, IV (FSK) MasterFormat® 07 21 13 See LCA, interpretation & rating systems Earthwool® Insulation Board Guide Spec, Technical Data Sheet See materials, interpretation & rating systems For spec help, contact us or call 317 421 8727 SM Transparency Report (EPD) + Material Health Overview ™ ™ EPD SUMMARY LCA Knauf Insulation, Inc. This environmental product Reference PCR One Knauf Drive 3rd-party verified declaration (EPD) was externally UL Part B: Building Envelope Thermal Shelbyville, IN 46176 verified by Harmony Environmental, Insulation v2.0 www.knaufinsulation.us Transparency Report (EPD) LLC, according to ISO 21930:2017; 317 398 4434 Regions; system boundaries UL Part A; UL Part B for Building 3rd-party verified North America; Cradle-to-grave Envelope Thermal Insulation Functional unit / ESL: Products ; and ISO 14025:2006. 2 Validity: 12/12/23 – 12/12/28 1 m installed insulation material, Harmony Environmental, LLC KNA – 12122023 – 008 packaging included, with thickness 16362 W. Briarwood Ct. that gives average thermal resistance Material Olathe, KS 66062 2 of R = 1m ·K/W over an estimated evaluation Material Health www.harmonyenviro.com SI service life (ESL) of 75 years (913) 780-3328 LCIA methodology: TRACI 2.1 Self-declared LCA software; LCI database LCA for Experts v10.7; LCA for Experts 2023 In accordance with ISO 14044 and the reference PCR, this life cycle assessment was conducted by Sustainable Minds and verified by Harmony Environmental, LLC. Public LCA: Knauf Insulation North America and Manson Insulation Products © 2023 | The SM Transparency Report [EPD]™ Program is operated by Sustainable Minds® (www.sustainableminds.com) | Privacy policy

Performance dashboard LCA & material results & interpretation How we make it greener SM Transparency Catalog Knauf Insulation Showroom Earthwool® Insulation Board LCA results & interpretation Earthwool® Insulation Board Unfaced FSK faced ASJ+ faced EPD additional content Material health Scope and summary What’s causing the greatest impacts All life cycle stages Cradle to gate Cradle to gate with options Cradle to grave The manufacturing stage dominates all impact categories except ozone depletion, where the raw material acquisition stage takes precedence. The Application energy required to melt the glass and produce the glass fibers is the largest Versatile product for thermal and acoustical applications such as: heating & air contributor to the manufacturing stage. The impact of the raw material conditioning ducts, power and process equipment, boiler and stack acquisition stage is mostly due to the batch and binder materials. The installations, metal and masonry walls, wall and roof panel systems, curtain wall contributions to outbound transportation are caused by the use of trucks and assemblies, and cavity walls. rail transport. The only impacts associated with installation and maintenance are due to the disposal of packaging waste, which is the smallest contributor Functional unit of all the stages. At the end of life, insulation is manually removed from the One square meter of installed insulation material, packaging included, with a building and landfilled. For all products, waste is dominated by the final 2 thickness that gives an average thermal resistance of R = 1m ·K/W with a disposal of the product. Non-hazardous waste accounts for waste generated SI building service life of 75 years. during manufacturing and installation. Reference service life: 75 years when installed per manufacturer’s instructions Raw materials acquisition and transportation Reference flow: 2.04 kg of unfaced product. The raw material acquisition stage is the second highest contributor for most impact categories, but ozone depletion potential is almost entirely A thickness of 0.0330m achieves the functional unit. (ASTM C518) generated from this stage. The raw materials acquisition stage impact is largely due to the borax, manganese oxide, and soda ash in the batch and the Manufacturing data sugars in the binder. Third-party verified ISO 14040/44 secondary LCI data Reporting period: January 2022 – December 2022 sets contribute more than 80% of the total impacts to ozone depletion. Location: Shelbyville, IN Manufacturing stage Default installation, packaging, and disposal scenarios The manufacturing stage has the most significant contribution to all impact At the installation site, insulation products are unpackaged and installed. categories , primarily due to the energy required to melt the glass and Staples may be used to install board products. The potential impact of the produce the glass fibers. Since some batch ingredients significantly staples is assumed to be negligible since their use is spread out over hundreds contribute to the respiratory effects category, they can lead to higher impact of sheets of product; therefore, they were not included in the model. results in the raw materials acquisition stage. However, since sand and borax No material is assumed to be lost or wasted. Scraps are typically used to fill are melted in the oven with the other batch materials, they are not released corners or crevices. Plastic packaging waste is disposed (9% to recycling, 68% into the air as fine particulates. Therefore, the calculated potential impacts as to landfill, and 17% to incineration), paper-based packaging waste is disposed shown in the results tables are likely much larger than the actual impacts in (68% to recycling, 20% to landfill, and 5% to incineration), and no maintenance the raw material acquisition stage. This implies that the manufacturing stage or replacement is required over the life of the building. After removal, the may have a greater share of the impact than what is displayed in the total insulation is assumed to be landfilled. Insulation and packaging waste are impacts by life cycle stage. assumed to be transported 100 miles for disposal. Distribution Outbound transportation is the third highest contributor to smog impacts. End of life The end-of-life impacts are largely due to landfilling of the product after it has been removed from the building and transported to a landfill. Since materials are assumed to be landfilled at the end of life rather than incinerated or reused/recycled, no materials are available for energy recovery or reuse/recycling. Embodied carbon Embodied carbon can be defined as the cradle-to-gate (A1-A3) global warming potential impacts. The total embodied carbon per functional unit of unfaced Earthwool® Insulation Board Insulation manufactured in Shelbyville, IN is 3.41E+00 kg CO -eq. 2 About 2018 results The 2018 Transparency Report for Earthwool® Insulation Board serves as a benchmark to which the 2023 results can be compared. One impact category was used for comparison to satisfy the LEED LCA optimization credit: global warming potential. Its reduction alone can contribute towards satisfying credits under LEED. The reduction in this impact category reflects that this report is valued at 1.5 products. How our product compares to previous years' results In 2018, Knauf Insulation North America published a product-specific Type III EPD for Earthwool® Insulation Board. The 2018 EPD and this 2023 EPD both followed the UL PCR Part A and Part B for Building Envelope Thermal Insulation. The life cycle results considered for benchmarking in each EPD were consistent; the data sources were consistent as they pertained to priority of primary and secondary data sources and application of specific secondary, non- LCI data; cut-off criteria were consistently applied; and product-specific use phase and end-of-life calculations were consistently applied. To ensure comparability, the 2018 benchmark EPD results were recalculated using the most recent LCA software version and most recently updated LCI data sets, then used for benchmarking with the 2023 updated EPD. The updated unfaced How we're making it greener 2018 total results from cradle to grave were as follows: global warming Knauf Insulation North America (KINA) is committed to providing 5.09E+00 kg CO -eq, ozone depletion potential 3.52E-10 kg CFC-11 eq, fossil products that conserve energy and preserve natural resources. 2 fuel depletion 6.74E+00 MJ surplus, and eutrophication 1.13E-03 kg N eq. Our products with ECOSE® Technology contain a bio-based binder Earthwool® Insulation Board results from 2023 show improvements across adhesive instead of a fossil fuel-based binder. the global warming potential and ozone depletion potential impact Our fiberglass contains on average over 60% recycled glass, which categories. The next highest performing impact category was fossil fuel requires about 20% less energy required to form glass fibers, and depletion, which showed only a 1% increase in impacts. The impact reductions results in about 25% reduction in embodied carbon. for GWP and ODP primarily stem from A3. Differences in manufacturing Our glass is audited by a 3rd party to ensure biosoluble chemistry from activities contribute significantly when comparing the 2023 results to the 2018 a health and safety standpoint. results and identifying the contributors to performance improvement. See how we make it greener The lowest performing impact category compared (higher impact results than in 2018) was eutrophication. The biggest contributors to eutrophication are the sugars in the binder and the water used in the fiberizing step during manufacturing. More water was consumed in this step as compared to previous years. LCA results Installation Raw material Disposal/ reuse/ Life cycle stage Manufacturing Transportation and acquisition recycling maintenance (X) A1 Raw (X) A3 (X) C1 (X) A4 Distribution (X) A5 Installation materials Manufacturing Deconstruction (X) A2 (X) C2 (X) B1 Use Transportation Transportation (X) C3 Waste (X) B2 Maintenance processing (X) B3 Repair (X) C4 Disposal (X) B4 Replacement Information modules: Included (X) | Excluded (MND)* (X) B5 Refurbishment *Module D is also excluded from this system boundary (MND). (X) B6 Operational energy use (X) B7 Operational water use SM Single Score Learn about SM Single Score results Impacts per 1 square meter of 1.18E-02 mPts 3.30E-02 mPts 1.11E-03 mPts 4.87E-04 mPts 1.31E-03 mPts insulation material Energy required to Truck and rail Transportation to Transportation to Batch material and Materials or processes contributing >20% melt the glass and transportation used landfill and landfill and binder material to total impacts in each life cycle stage produce the glass to transport product landfilling of landfilling of product production. fibers. to building site. packaging materials. at end of life. TRACI v2.1 results per functional unit (unfaced Earthwool® Insulation Board - Shelbyville, IN) Installation Raw material Disposal/ reuse/ Life cycle stage Manufacturing Transportation and acquisition recycling maintenance Ecological damage Impact category Unit Global warming kg CO eq 2.11E-01 3.20E+00 5.98E-02 7.74E-02 6.32E-02 2 Ozone depletion kg CFC-11 eq 2.31E-12 4.32E-13 1.33E-16 1.27E-16 1.82E-15 Acidification kg SO eq 2.62E-03 6.16E-03 3.07E-04 1.65E-04 2.65E-04 2 Eutrophication kg N eq 1.74E-03 1.77E-03 2.63E-05 2.70E-05 1.63E-05 Human health damage Impact category Unit Smog kg O eq 2.76E-02 1.19E-01 1.05E-02 9.74E-04 5.18E-03 3 Respiratory effects kg PM eq 1.90E-04 3.67E-04 1.50E-05 3.88E-06 1.79E-05 2.5 Additional environmental information Impact category Unit Carcinogenics CTU 7.7% 89.8% 0.2% 0.1% 2.2% h Non-carcinogenics CTU 12.6% 81.7% 0.4% 0.3% 5.1% h Ecotoxicity CTU 23.7% 74.9% 0.7% 0.1% 0.6% e Fossil fuel depletion MJ surplus 1.16E+00 5.38E+00 1.12E-01 1.14E-02 1.24E-01 References Rating systems LCA Background Report The intent is to reward project teams for selecting products from Knauf Insulation North America and Manson Insulation Products LCA manufacturers who have verified improved life-cycle environmental Background Report (public version), Knauf Insulation North America (KINA) performance. 2023; developed using the TRACI v2.1 and CML impact assessment methodologies, and LCA for Experts modeling software . LEED BD+C: New Construction | v4 - LEED v4 Building product disclosure and optimization ISO 14025, “Sustainability in buildings and civil engineering works -- Core rules for environmental product declarations of construction products and Environmental product declarations services” Industry-wide (generic) EPD ½product ISO 21930:2017 serves as the core PCR along with UL Part A. Product-specific Type III EPD 1 product UL Part A: Life Cycle Assessment Calculation Rules and Report Requirements v4.0 LEED BD+C: New Construction | v4.1 - LEED v4.1 March, 2022. PCR review conducted by Lindita Bushi, PhD, Chair (Athena Sustainable Materials Institute), lindita.bushi@athenasmi.org ; Hugues Imbeault- Building product disclosure and optimization Tétreault (Group AGECO); and Jack Geibig (Ecoform). Environmental product declarations UL Part B: Building Envelope Thermal Insulation EPD Requirements, v2.0 Industry-wide (generic) EPD 1 product April, 2018. PCR review conducted by Thomas Gloria, PhD, Chair (Industrial Ecology Consultants) t.gloria@industrial-ecology.com ; Christoph Koffler, PhD (thinkstep); Andre Desjarlais (Oak Ridge National Laboratory). Product-specific Type III EPD 1.5 product 2018 Transparency Report for Earthwool® Insulation Board, Knauf Insulation LCA Optimization 1.5 products North America (KINA) 2018. Collaborative for High Performance Schools National UL Environment General Program Instructions v2.4 , July 2018 (available Criteria upon request) MW C5.1 – Environmental Product Declarations Download PDF SM Transparency Report / EPD Third-party certified type III EPD 2 point SM Transparency Reports (TR) are ISO 14025 Type III environmental declarations (EPD) that enable purchasers and users to compare the potential environmental performance of products on a life cycle basis. Environmental declarations from different programs (ISO 14025) may not be Green Globes for New Construction and Sustainable comparable. Comparison of the environmental performance of products using EPD information Interiors shall be based on the product’s use and impacts at the building level, and therefore EPDs may not be used for comparability purposes when not considering the building energy use phase as Materials and resources instructed under this PCR. Full conformance with the PCR for Building Envelope Thermal Insulation allows EPD comparability only when all stages of a life cycle have been considered. However, variations and deviations are possible. Example of variations: Different LCA software NC 3.5.1.2 Path B: Prescriptive Path for Building Core and Shell and background LCI datasets may lead to differences results for upstream or downstream of the life cycle stages declared. NC 3.5.2.2 and SI 4.1.2 Path B: Prescriptive Path for Interior Fit-outs BREEAM New Construction 2018 Mat 02 - Environmental impacts from construction products Environmental Product Declarations (EPD) Industry-average EPD .5 point Multi-product specific EPD .75 points Product-specific EPD 1 point SM Transparency Report (EPD) + Material Health Overview ™ ™ EPD LCA SUMMARY Knauf Insulation, Inc. This environmental product Reference PCR One Knauf Drive 3rd-party verified declaration (EPD) was externally UL Part B: Building Envelope Thermal Shelbyville, IN 46176 verified by Harmony Environmental, Insulation v2.0 www.knaufinsulation.us Transparency Report (EPD) LLC, according to ISO 21930:2017; 317 398 4434 Regions; system boundaries UL Part A; UL Part B for Building 3rd-party verified North America; Cradle-to-grave Envelope Thermal Insulation Functional unit / ESL: Products ; and ISO 14025:2006. 2 Validity: 12/12/23 – 12/12/28 1 m installed insulation material, Harmony Environmental, LLC KNA – 12122023 – 008 packaging included, with thickness 16362 W. Briarwood Ct. that gives average thermal resistance Material Olathe, KS 66062 2 of R = 1m ·K/W over an estimated evaluation SI Material Health www.harmonyenviro.com service life (ESL) of 75 years (913) 780-3328 LCIA methodology: TRACI 2.1 Self-declared LCA software; LCI database LCA for Experts v10.7; LCA for Experts 2023 In accordance with ISO 14044 and the reference PCR, this life cycle assessment was conducted by Sustainable Minds and verified by Harmony Environmental, LLC. Public LCA: Knauf Insulation North America and Manson Insulation Products © 2023 | The SM Transparency Report [EPD]™ Program is operated by Sustainable Minds® (www.sustainableminds.com) | Privacy policy

Performance dashboard LCA & material results & interpretation How we make it greener SM Transparency Catalog Knauf Insulation Showroom Earthwool® Insulation Board LCA results & interpretation Earthwool® Insulation Board Unfaced FSK faced ASJ+ faced EPD additional content Material health Scope and summary What’s causing the greatest impacts All life cycle stages Cradle to gate Cradle to gate with options Cradle to grave The manufacturing stage dominates all impact categories except ozone depletion, where the raw material acquisition stage takes precedence. The Application energy required to melt the glass and produce the glass fibers is the largest Versatile product for thermal and acoustical applications such as: heating & air contributor to the manufacturing stage. The impact of the raw material conditioning ducts, power and process equipment, boiler and stack acquisition stage is mostly due to the batch and binder materials. The installations, metal and masonry walls, wall and roof panel systems, curtain wall contributions to outbound transportation are caused by the use of trucks and assemblies, and cavity walls. rail transport. The only impacts associated with installation and maintenance are due to the disposal of packaging waste, which is the smallest contributor Functional unit of all the stages. At the end of life, insulation is manually removed from the One square meter of installed insulation material, packaging included, with a building and landfilled. For all products, waste is dominated by the final 2 thickness that gives an average thermal resistance of R = 1m ·K/W with a disposal of the product. Non-hazardous waste accounts for waste generated SI building service life of 75 years. during manufacturing and installation. Reference service life: 75 years when installed per manufacturer’s instructions Raw materials acquisition and transportation Reference flow: 2.19 kg of product with foil skrim kraft (FSK) facer. The raw material acquisition stage is the second highest contributor for most impact categories, but ozone depletion potential is almost entirely A thickness of 0.0330m achieves the functional unit. (ASTM C518) generated from this stage. The raw materials acquisition stage impact is largely due to the borax, manganese oxide, and soda ash in the batch and the Manufacturing data sugars in the binder. Third-party verified ISO 14040/44 secondary LCI data Reporting period: January 2022 – December 2022 sets contribute more than 80% of the total impacts to ozone depletion. Location: Shelbyville, IN Manufacturing stage Default installation, packaging, and disposal scenarios The manufacturing stage has the most significant contribution to all impact At the installation site, insulation products are unpackaged and installed. categories , primarily due to the energy required to melt the glass and Staples may be used to install board products. The potential impact of the produce the glass fibers. Since some batch ingredients significantly staples is assumed to be negligible since their use is spread out over hundreds contribute to the respiratory effects category, they can lead to higher impact of sheets of product; therefore, they were not included in the model. results in the raw materials acquisition stage. However, since sand and borax No material is assumed to be lost or wasted. Scraps are typically used to fill are melted in the oven with the other batch materials, they are not released corners or crevices. Plastic packaging waste is disposed (9% to recycling, 68% into the air as fine particulates. Therefore, the calculated potential impacts as to landfill, and 17% to incineration), paper-based packaging waste is disposed shown in the results tables are likely much larger than the actual impacts in (68% to recycling, 20% to landfill, and 5% to incineration), and no maintenance the raw material acquisition stage. This implies that the manufacturing stage or replacement is required over the life of the building. After removal, the may have a greater share of the impact than what is displayed in the total insulation is assumed to be landfilled. Insulation and packaging waste are impacts by life cycle stage. assumed to be transported 100 miles for disposal. Distribution Outbound transportation is the third highest contributor to smog impacts. End of life The end-of-life impacts are largely due to landfilling of the product after it has been removed from the building and transported to a landfill. Since materials are assumed to be landfilled at the end of life rather than incinerated or reused/recycled, no materials are available for energy recovery or reuse/recycling. Embodied carbon Embodied carbon can be defined as the cradle-to-gate (A1-A3) global warming potential impacts. The total embodied carbon per functional unit of FSK-faced Earthwool® Insulation Board Insulation manufactured in Shelbyville, IN is 4.60E+00 kg CO -eq. 2 About 2018 results The 2018 Transparency Report for Earthwool® Insulation Board serves as a benchmark to which the 2023 results can be compared. One impact category was used for comparison to satisfy the LEED LCA optimization credit: global warming potential. Its reduction alone can contribute towards satisfying credits under LEED. The reduction in this impact category reflects that this report is valued at 1.5 products. How our product compares to previous years' results In 2018, Knauf Insulation North America published a product-specific Type III EPD for Earthwool® Insulation Board. The 2018 EPD and this 2023 EPD both followed the UL PCR Part A and Part B for Building Envelope Thermal Insulation. The life cycle results considered for benchmarking in each EPD were consistent; the data sources were consistent as they pertained to priority of primary and secondary data sources and application of specific secondary, non- LCI data; cut-off criteria were consistently applied; and product-specific use phase and end-of-life calculations were consistently applied. To ensure comparability, the 2018 benchmark EPD results were recalculated using the How we're making it greener most recent LCA software version and most recently updated LCI data sets, then used for benchmarking with the 2023 updated EPD. The updated FSK- Knauf Insulation North America (KINA) is committed to providing faced 2018 total results from cradle to grave were as follows: global warming products that conserve energy and preserve natural resources. 5.48E+00 kg CO -eq, ozone depletion potential 2.49E-09 kg CFC-11 eq, 2 Our products with ECOSE® Technology contain a bio-based binder acidification 9.11E-03 kg SO -eq, and eutrophication 1.24E-03 kg N eq. 2 adhesive instead of a fossil fuel-based binder. Our fiberglass contains on average over 60% recycled glass, which Earthwool® Insulation Board results from 2023 show improvements across requires about 20% less energy required to form glass fibers, and the global warming potential and ozone depletion potential impact results in about 25% reduction in embodied carbon. categories. The next highest performing impact category was acidification, Our glass is audited by a 3rd party to ensure biosoluble chemistry from which showed only a 14% increase in impacts. The impact reductions for GWP a health and safety standpoint. and ODP primarily stem from A3. Differences in manufacturing activities contribute significantly when comparing the 2023 results to the 2018 results See how we make it greener and identifying the contributors to performance improvement. The lowest performing impact category compared (higher impact results than in 2018) was eutrophication. The biggest contributors to eutrophication are the sugars in the binder and the water used in the fiberizing step during manufacturing. More water was consumed in this step as compared to previous years. LCA results Installation Raw material Disposal/ reuse/ Life cycle stage Manufacturing Transportation and acquisition recycling maintenance (X) A1 Raw (X) A3 (X) C1 (X) A4 Distribution (X) A5 Installation materials Manufacturing Deconstruction (X) A2 (X) C2 (X) B1 Use Transportation Transportation (X) C3 Waste (X) B2 Maintenance processing (X) B3 Repair (X) C4 Disposal (X) B4 Replacement Information modules: Included (X) | Excluded (MND)* (X) B5 Refurbishment *Module D is also excluded from this system boundary (MND). (X) B6 Operational energy use (X) B7 Operational water use SM Single Score Learn about SM Single Score results Impacts per 1 square meter of 1.22E-02 mPts 3.71E-02 mPts 1.19E-03 mPts 5.23E-04 mPts 1.40E-03 mPts insulation material Energy required to Truck and rail Transportation to Transportation to Batch material and Materials or processes contributing >20% melt the glass and transportation used landfill and landfill and binder material to total impacts in each life cycle stage produce the glass to transport product landfilling of landfilling of product production. fibers. to building site. packaging materials. at end of life. TRACI v2.1 results per functional unit (FSK-faced Earthwool® Insulation Board - Shelbyville, IN) Installation Raw material Disposal/ reuse/ Life cycle stage Manufacturing Transportation and acquisition recycling maintenance Ecological damage Impact category Unit Global warming kg CO eq 2.18E-01 4.38E+00 6.42E-02 8.31E-02 6.79E-02 2 Ozone depletion kg CFC-11 eq 2.39E-12 1.05E-11 1.43E-16 1.36E-16 1.96E-15 Acidification kg SO eq 2.71E-03 6.89E-03 3.29E-04 1.77E-04 2.85E-04 2 Eutrophication kg N eq 1.80E-03 1.67E-03 2.82E-05 2.90E-05 1.75E-05 Human health damage Impact category Unit Smog kg O eq 2.86E-02 1.36E-01 1.13E-02 1.05E-03 5.56E-03 3 Respiratory effects kg PM eq 1.97E-04 3.66E-04 1.61E-05 4.17E-06 1.92E-05 2.5 Additional environmental information Impact category Unit Carcinogenics CTU 7.5% 90.0% 0.2% 0.1% 2.2% h Non-carcinogenics CTU 12.4% 81.8% 0.4% 0.3% 5.2% h Ecotoxicity CTU 22.6% 76.0% 0.7% 0.1% 0.6% e Fossil fuel depletion MJ surplus 1.20E+00 8.87E+00 1.20E-01 1.23E-02 1.33E-01 References Rating systems LCA Background Report The intent is to reward project teams for selecting products from Knauf Insulation North America and Manson Insulation Products LCA manufacturers who have verified improved life-cycle environmental Background Report (public version), Knauf Insulation North America (KINA) performance. 2023; developed using the TRACI v2.1 and CML impact assessment methodologies, and LCA for Experts modeling software . LEED BD+C: New Construction | v4 - LEED v4 Building product disclosure and optimization ISO 14025, “Sustainability in buildings and civil engineering works -- Core rules for environmental product declarations of construction products and Environmental product declarations services” Industry-wide (generic) EPD ½product ISO 21930:2017 serves as the core PCR along with UL Part A. Product-specific Type III EPD 1 product UL Part A: Life Cycle Assessment Calculation Rules and Report Requirements v4.0 LEED BD+C: New Construction | v4.1 - LEED v4.1 March, 2022. PCR review conducted by Lindita Bushi, PhD, Chair (Athena Sustainable Materials Institute), lindita.bushi@athenasmi.org ; Hugues Imbeault- Building product disclosure and optimization Tétreault (Group AGECO); and Jack Geibig (Ecoform). Environmental product declarations UL Part B: Building Envelope Thermal Insulation EPD Requirements, v2.0 Industry-wide (generic) EPD 1 product April, 2018. PCR review conducted by Thomas Gloria, PhD, Chair (Industrial Ecology Consultants) t.gloria@industrial-ecology.com ; Christoph Koffler, PhD (thinkstep); Andre Desjarlais (Oak Ridge National Laboratory). Product-specific Type III EPD 1.5 product 2018 Transparency Report for Earthwool® Insulation Board, Knauf Insulation LCA Optimization 1.5 products North America (KINA) 2018. Collaborative for High Performance Schools National UL Environment General Program Instructions v2.4 , July 2018 (available Criteria upon request) MW C5.1 – Environmental Product Declarations Download PDF SM Transparency Report / EPD Third-party certified type III EPD 2 point SM Transparency Reports (TR) are ISO 14025 Type III environmental declarations (EPD) that enable purchasers and users to compare the potential environmental performance of products on a life cycle basis. Environmental declarations from different programs (ISO 14025) may not be Green Globes for New Construction and Sustainable comparable. Comparison of the environmental performance of products using EPD information Interiors shall be based on the product’s use and impacts at the building level, and therefore EPDs may not be used for comparability purposes when not considering the building energy use phase as Materials and resources instructed under this PCR. Full conformance with the PCR for Building Envelope Thermal Insulation allows EPD comparability only when all stages of a life cycle have been considered. However, variations and deviations are possible. Example of variations: Different LCA software NC 3.5.1.2 Path B: Prescriptive Path for Building Core and Shell and background LCI datasets may lead to differences results for upstream or downstream of the life cycle stages declared. NC 3.5.2.2 and SI 4.1.2 Path B: Prescriptive Path for Interior Fit-outs BREEAM New Construction 2018 Mat 02 - Environmental impacts from construction products Environmental Product Declarations (EPD) Industry-average EPD .5 point Multi-product specific EPD .75 points Product-specific EPD 1 point SM Transparency Report (EPD) + Material Health Overview ™ ™ EPD LCA SUMMARY Knauf Insulation, Inc. This environmental product Reference PCR One Knauf Drive 3rd-party verified declaration (EPD) was externally UL Part B: Building Envelope Thermal Shelbyville, IN 46176 verified by Harmony Environmental, Insulation v2.0 www.knaufinsulation.us Transparency Report (EPD) LLC, according to ISO 21930:2017; 317 398 4434 Regions; system boundaries UL Part A; UL Part B for Building 3rd-party verified North America; Cradle-to-grave Envelope Thermal Insulation Functional unit / ESL: Products ; and ISO 14025:2006. 2 Validity: 12/12/23 – 12/12/28 1 m installed insulation material, Harmony Environmental, LLC KNA – 12122023 – 008 packaging included, with thickness 16362 W. Briarwood Ct. that gives average thermal resistance Material Olathe, KS 66062 2 of R = 1m ·K/W over an estimated evaluation SI Material Health www.harmonyenviro.com service life (ESL) of 75 years (913) 780-3328 LCIA methodology: TRACI 2.1 Self-declared LCA software; LCI database LCA for Experts v10.7; LCA for Experts 2023 In accordance with ISO 14044 and the reference PCR, this life cycle assessment was conducted by Sustainable Minds and verified by Harmony Environmental, LLC. Public LCA: Knauf Insulation North America and Manson Insulation Products © 2023 | The SM Transparency Report [EPD]™ Program is operated by Sustainable Minds® (www.sustainableminds.com) | Privacy policy
Performance dashboard LCA & material results & interpretation How we make it greener SM Transparency Catalog Knauf Insulation Showroom Earthwool® Insulation Board LCA results & interpretation Earthwool® Insulation Board Unfaced FSK faced ASJ+ faced EPD additional content Material health Scope and summary What’s causing the greatest impacts All life cycle stages Cradle to gate Cradle to gate with options Cradle to grave The manufacturing stage dominates all impact categories except ozone depletion, where the raw material acquisition stage takes precedence. The Application energy required to melt the glass and produce the glass fibers is the largest Versatile product for thermal and acoustical applications such as: heating & air contributor to the manufacturing stage. The impact of the raw material conditioning ducts, power and process equipment, boiler and stack acquisition stage is mostly due to the batch and binder materials. The installations, metal and masonry walls, wall and roof panel systems, curtain wall contributions to outbound transportation are caused by the use of trucks and assemblies, and cavity walls. rail transport. The only impacts associated with installation and maintenance are due to the disposal of packaging waste, which is the smallest contributor Functional unit of all the stages. At the end of life, insulation is manually removed from the One square meter of installed insulation material, packaging included, with a building and landfilled. For all products, waste is dominated by the final 2 thickness that gives an average thermal resistance of R = 1m ·K/W with a disposal of the product. Non-hazardous waste accounts for waste generated SI building service life of 75 years. during manufacturing and installation. Reference service life: 75 years when installed per manufacturer’s instructions Raw materials acquisition and transportation Reference flow: 2.30 kg of product with all-service jacket (ASJ+) facer. The raw material acquisition stage is the second highest contributor for most impact categories, but ozone depletion potential is almost entirely A thickness of 0.0330m achieves the functional unit. (ASTM C518) generated from this stage. The raw materials acquisition stage impact is largely due to the borax, manganese oxide, and soda ash in the batch and the Manufacturing data sugars in the binder. Third-party verified ISO 14040/44 secondary LCI data Reporting period: January 2022 – December 2022 sets contribute more than 80% of the total impacts to ozone depletion. Location: Shelbyville, IN Manufacturing stage Default installation, packaging, and disposal scenarios The manufacturing stage has the most significant contribution to all impact At the installation site, insulation products are unpackaged and installed. categories , primarily due to the energy required to melt the glass and Staples may be used to install board products. The potential impact of the produce the glass fibers. Since some batch ingredients significantly staples is assumed to be negligible since their use is spread out over hundreds contribute to the respiratory effects category, they can lead to higher impact of sheets of product; therefore, they were not included in the model. results in the raw materials acquisition stage. However, since sand and borax No material is assumed to be lost or wasted. Scraps are typically used to fill are melted in the oven with the other batch materials, they are not released corners or crevices. Plastic packaging waste is disposed (9% to recycling, 68% into the air as fine particulates. Therefore, the calculated potential impacts as to landfill, and 17% to incineration), paper-based packaging waste is disposed shown in the results tables are likely much larger than the actual impacts in (68% to recycling, 20% to landfill, and 5% to incineration), and no maintenance the raw material acquisition stage. This implies that the manufacturing stage or replacement is required over the life of the building. After removal, the may have a greater share of the impact than what is displayed in the total insulation is assumed to be landfilled. Insulation and packaging waste are impacts by life cycle stage. assumed to be transported 100 miles for disposal. Distribution Outbound transportation is the third highest contributor to smog impacts. End of life The end-of-life impacts are largely due to landfilling of the product after it has been removed from the building and transported to a landfill. Since materials are assumed to be landfilled at the end of life rather than incinerated or reused/recycled, no materials are available for energy recovery or reuse/recycling. Embodied carbon Embodied carbon can be defined as the cradle-to-gate (A1-A3) global warming potential impacts. The total embodied carbon per functional unit of ASJ+ faced Earthwool® Insulation Board Insulation manufactured in Shelbyville, IN is 5.08E+00 kg CO -eq. 2 About 2018 results The 2018 Transparency Report for Earthwool® Insulation Board serves as a benchmark to which the 2023 results can be compared. One impact category was used for comparison to satisfy the LEED LCA optimization credit: global warming potential. Its reduction alone can contribute towards satisfying credits under LEED. The reduction in this impact category reflects that this report is valued at 1 product. How our product compares to previous years' results In 2018, Knauf Insulation North America published a product-specific Type III EPD for Earthwool® Insulation Board. The 2018 EPD and this 2023 EPD both followed the UL PCR Part A and Part B for Building Envelope Thermal Insulation. The life cycle results considered for benchmarking in each EPD were consistent; the data sources were consistent as they pertained to priority of primary and secondary data sources and application of specific secondary, non- LCI data; cut-off criteria were consistently applied; and product-specific use phase and end-of-life calculations were consistently applied. To ensure comparability, the 2018 benchmark EPD results were recalculated using the How we're making it greener most recent LCA software version and most recently updated LCI data sets, then used for benchmarking with the 2023 updated EPD. The updated ASJ+ Knauf Insulation North America (KINA) is committed to providing faced 2018 total results from cradle to grave were as follows: global warming products that conserve energy and preserve natural resources. 5.76E+00 kg CO -eq, ozone depletion potential 2.88E-09 kg CFC-11 eq, 2 Our products with ECOSE® Technology contain a bio-based binder acidification 9.66E-03 kg SO -eq, and eutrophication 1.30E-03 kg N eq. 2 adhesive instead of a fossil fuel-based binder. Our fiberglass contains on average over 60% recycled glass, which Earthwool® Insulation Board results from 2023 show improvements across requires about 20% less energy required to form glass fibers, and the global warming potential and ozone depletion potential impact results in about 25% reduction in embodied carbon. categories. The next highest performing impact category was acidification, Our glass is audited by a 3rd party to ensure biosoluble chemistry from which showed only a 22% increase in impacts. The impact reductions for GWP a health and safety standpoint. and ODP primarily stem from A3. Differences in manufacturing activities contribute significantly when comparing the 2023 results to the 2018 results See how we make it greener and identifying the contributors to performance improvement. The lowest performing impact category compared (higher impact results than in 2018) was eutrophication. The biggest contributors to eutrophication are the sugars in the binder and the water used in the fiberizing step during manufacturing. More water was consumed in this step as compared to previous years. LCA results Installation Raw material Disposal/ reuse/ Life cycle stage Manufacturing Transportation and acquisition recycling maintenance (X) A1 Raw (X) A3 (X) C1 (X) A4 Distribution (X) A5 Installation materials Manufacturing Deconstruction (X) A2 (X) C2 (X) B1 Use Transportation Transportation (X) C3 Waste (X) B2 Maintenance processing (X) B3 Repair (X) C4 Disposal (X) B4 Replacement Information modules: Included (X) | Excluded (MND)* (X) B5 Refurbishment *Module D is also excluded from this system boundary (MND). (X) B6 Operational energy use (X) B7 Operational water use SM Single Score Learn about SM Single Score results Impacts per 1 square meter of 1.32E-02 mPts 4.28E-02 mPts 1.25E-03 mPts 5.50E-04 mPts 1.47E-03 mPts insulation material Energy required to Truck and rail Transportation to Transportation to Batch material and Materials or processes contributing >20% melt the glass and transportation used landfill and landfill and binder material to total impacts in each life cycle stage produce the glass to transport product landfilling of landfilling of product production. fibers. to building site. packaging materials. at end of life. TRACI v2.1 results per functional unit (ASJ+ faced Earthwool® Insulation Board - Shelbyville, IN) Installation Raw material Disposal/ reuse/ Life cycle stage Manufacturing Transportation and acquisition recycling maintenance Ecological damage Impact category Unit Global warming kg CO eq 2.34E-01 4.85E+00 6.75E-02 8.74E-02 7.14E-02 2 Ozone depletion kg CFC-11 eq 2.57E-12 1.35E-09 1.51E-16 1.43E-16 2.06E-15 Acidification kg SO eq 2.91E-03 8.01E-03 3.46E-04 1.86E-04 2.99E-04 2 Eutrophication kg N eq 1.94E-03 1.84E-03 2.97E-05 3.05E-05 1.84E-05 Human health damage Impact category Unit Smog kg O eq 3.07E-02 1.53E-01 1.19E-02 1.10E-03 5.85E-03 3 Respiratory effects kg PM eq 2.12E-04 4.37E-04 1.69E-05 4.38E-06 2.02E-05 2.5 Additional environmental information Impact category Unit Carcinogenics CTU 7.4% 90.1% 0.2% 0.1% 2.1% h Non-carcinogenics CTU 12.1% 82.3% 0.4% 0.3% 5.0% h Ecotoxicity CTU 22.4% 76.3% 0.7% 0.1% 0.6% e Fossil fuel depletion MJ surplus 1.29E+00 9.79E+00 1.27E-01 1.29E-02 1.40E-01 References Rating systems LCA Background Report The intent is to reward project teams for selecting products from Knauf Insulation North America and Manson Insulation Products LCA manufacturers who have verified improved life-cycle environmental Background Report (public version), Knauf Insulation North America (KINA) performance. 2023; developed using the TRACI v2.1 and CML impact assessment methodologies, and LCA for Experts modeling software . LEED BD+C: New Construction | v4 - LEED v4 Building product disclosure and optimization ISO 14025, “Sustainability in buildings and civil engineering works -- Core rules for environmental product declarations of construction products and Environmental product declarations services” Industry-wide (generic) EPD ½product ISO 21930:2017 serves as the core PCR along with UL Part A. Product-specific Type III EPD 1 product UL Part A: Life Cycle Assessment Calculation Rules and Report Requirements v4.0 LEED BD+C: New Construction | v4.1 - LEED v4.1 March, 2022. PCR review conducted by Lindita Bushi, PhD, Chair (Athena Sustainable Materials Institute), lindita.bushi@athenasmi.org ; Hugues Imbeault- Building product disclosure and optimization Tétreault (Group AGECO); and Jack Geibig (Ecoform). Environmental product declarations UL Part B: Building Envelope Thermal Insulation EPD Requirements, v2.0 Industry-wide (generic) EPD 1 product April, 2018. PCR review conducted by Thomas Gloria, PhD, Chair (Industrial Ecology Consultants) t.gloria@industrial-ecology.com ; Christoph Koffler, PhD (thinkstep); Andre Desjarlais (Oak Ridge National Laboratory). Product-specific Type III EPD 1.5 product 2018 Transparency Report for Earthwool® Insulation Board, Knauf Insulation LCA Optimization 1 product North America (KINA) 2018. Collaborative for High Performance Schools National UL Environment General Program Instructions v2.4 , July 2018 (available Criteria upon request) MW C5.1 – Environmental Product Declarations Download PDF SM Transparency Report / EPD Third-party certified type III EPD 2 point SM Transparency Reports (TR) are ISO 14025 Type III environmental declarations (EPD) that enable purchasers and users to compare the potential environmental performance of products on a life cycle basis. Environmental declarations from different programs (ISO 14025) may not be Green Globes for New Construction and Sustainable comparable. Comparison of the environmental performance of products using EPD information Interiors shall be based on the product’s use and impacts at the building level, and therefore EPDs may not be used for comparability purposes when not considering the building energy use phase as Materials and resources instructed under this PCR. Full conformance with the PCR for Building Envelope Thermal Insulation allows EPD comparability only when all stages of a life cycle have been considered. However, variations and deviations are possible. Example of variations: Different LCA software NC 3.5.1.2 Path B: Prescriptive Path for Building Core and Shell and background LCI datasets may lead to differences results for upstream or downstream of the life cycle stages declared. NC 3.5.2.2 and SI 4.1.2 Path B: Prescriptive Path for Interior Fit-outs BREEAM New Construction 2018 Mat 02 - Environmental impacts from construction products Environmental Product Declarations (EPD) Industry-average EPD .5 point Multi-product specific EPD .75 points Product-specific EPD 1 point SM Transparency Report (EPD) + Material Health Overview ™ ™ EPD LCA SUMMARY Knauf Insulation, Inc. This environmental product Reference PCR One Knauf Drive 3rd-party verified declaration (EPD) was externally UL Part B: Building Envelope Thermal Shelbyville, IN 46176 verified by Harmony Environmental, Insulation v2.0 www.knaufinsulation.us Transparency Report (EPD) LLC, according to ISO 21930:2017; 317 398 4434 Regions; system boundaries UL Part A; UL Part B for Building 3rd-party verified North America; Cradle-to-grave Envelope Thermal Insulation Functional unit / ESL: Products ; and ISO 14025:2006. 2 Validity: 12/12/23 – 12/12/28 1 m installed insulation material, Harmony Environmental, LLC KNA – 12122023 – 008 packaging included, with thickness 16362 W. Briarwood Ct. that gives average thermal resistance Material Olathe, KS 66062 2 of R = 1m ·K/W over an estimated evaluation SI Material Health www.harmonyenviro.com service life (ESL) of 75 years (913) 780-3328 LCIA methodology: TRACI 2.1 Self-declared LCA software; LCI database LCA for Experts v10.7; LCA for Experts 2023 In accordance with ISO 14044 and the reference PCR, this life cycle assessment was conducted by Sustainable Minds and verified by Harmony Environmental, LLC. Public LCA: Knauf Insulation North America and Manson Insulation Products © 2023 | The SM Transparency Report [EPD]™ Program is operated by Sustainable Minds® (www.sustainableminds.com) | Privacy policy
Performance dashboard LCA & material results & interpretation How we make it greener SM Transparency Catalog Knauf Insulation Showroom Earthwool® Insulation Board EPD additional content Earthwool® Insulation Board Unfaced FSK faced ASJ+ faced EPD additional content Material health Data Scenarios and additional technical information Background This product-specific plant-specific declaration was created by PARAMETER VALUE UNIT collecting production data from the Shelbyville, IN production location. Transport to the building site [A4] Secondary data sources include those available in LCA for Experts 2023 Vehicle type Truck and trailer - databases. Fuel type Diesel - Allocation The PCR prescribes where and how allocation occurs. Since only Average distance from facility-level data were available, allocation among the facilities' other co- manufacturing to installation 161 km products was necessary to determine the input and output flows associated site with the product. Allocation of batch materials and energy was done on a Capacity utilization 27 % product output mass basis, binder materials were allocated based on the mass Gross density 48.1 kg/m³ calculated from the bill of materials and binder formulations, facers were allocated based on product area, and packaging was allocated based on mass Capacity utilization volume 1 - per package of product. Allocation of transportation was based on either factor weight or volume, depending on which was found to restrict the amount of cargo; the limiting factor was used in allocating transportation. Installation into the building [A5] Mass of plastic packaging Cut-off criteria for the inclusion of mass and energy flows are 1% of renewable 0.00543 kg waste primary resource (energy) usage, 1% nonrenewable primary resource (energy) usage, 1% of the total mass input of that unit process, and 1% of environmental Biogenic carbon content of 0.451 kg CO packaging 2 impacts. The total of neglected input flows per module does not exceed 5% of energy usage, mass, and environmental impacts. The only exceptions to these criteria are substances with hazardous and toxic properties, which must be End of life [C1-C4] listed even when the given process unit is under the cut-off criterion of 1% of Following manual removal of the insulation, the total mass. No known flows are deliberately excluded from this declaration; it was assumed to be transported 100 miles therefore, these criteria have been met. Biogenic carbon is included in reported Assumptions for scenario to disposal. The PCR prescribes that 100% development results. of the insulation is sent to landfill, where no prior waste processing is required. Quality Temporal and technological representativeness are considered to be Collected with Unfaced: 1.75 kg high. Geographical representativeness is considered to be high. All relevant Collection process mixed construction FSK: 1.90 kg process steps for the product system were considered and modeled. The waste ASJ+: 2.01 kg process chain is considered sufficiently complete with regards to the goal and Unfaced: 1.75 kg scope of this study. The product system was checked for mass balance and Product for final Disposal FSK: 1.90 kg completeness of the inventory. Capital goods were excluded since they are deposition in landfill ASJ+: 2.01 kg assumed not to significantly affect the conclusions of the LCA. Otherwise, no data were knowingly omitted. For more information on data quality, see the LCA background report. Technical properties Earthwool® Insulation Board is sold in LCIA impact factors required by the PCR are global warming, ozone depletion, sheets. One carton contains eight pieces Dimensions/quantities acidification, eutrophication, smog, and fossil fuel depletion; “These six impact delivered to installation wrapped in stretch wrap. The dimensions categories are globally deemed mature enough to be included in Type III site for each roll of the product are 1.5” – 2” environmental declarations. Other categories are being developed and defined thick, 24” in width, and 48” in length. and LCA should continue making advances in their development. However, the EPD users shall not use additional measures for comparative purposes.” ASTM C612: Type IA (1.6, 2.25, 3.0, 4.25, 6.0 pcf), Type IB (3.0, 4.25, 6.0 pcf) ASTM or ANSI product Flow diagram ASTM C795 specification ASTM C1136: Type I, II, III, IV, VIII (ASJ+), Type II, IV (FSK) Corrosion ASTM C1617; Pass TAPPI Test T803, Beach Units Puncture Resistance FSK facing: 25, ASJ+ facing: 120 Water vapor sorption (by ASTM C1104; Less than 5% weight) Shrinkage ASTM C356; Less than 0.3% Mold growth ASTM C1338; Pass Surface burning ASTM E84, UL 723, CAN/ULC S102, NFPA characteristics (flame 90A and 90B; UL/ULC Classified FHC 25/50 spread/smoke developed) Major system boundary exclusions Capital goods and infrastructure; maintenance of operation and support equipment; Manufacture & transport of packaging materials not associated with final product; Human labor and employee transport; Building operational energy and water use not associated with final product. Major assumptions and limitations Due to the nature of fiberglass insulation, it is anticipated that it will last for the lifetime of the building, so the reference service life (RSL) is considered to be the same as the building estimated service life (ESL) of 75 years. Generic data sets used for material inputs, transport, and waste processing are considered good quality, but actual impacts from material suppliers, transport carriers, and local waste processing may vary. The impact assessment methodology categories do not represent all possible environmental impact categories. Characterization factors used within the impact assessment methodology may contain varying levels of uncertainty. LCA results are relative expressions and do not predict impacts on category endpoints, the exceeding of thresholds, safety margins or risks. Unfaced Earthwool® Insulation Board produced in Shelbyville, IN: LCIA results, resource use, output and waste flows, and carbon emissions & removals per functional unit Parameter Unit A1-A3 A4 A5 B1-B7 C1 C2 C3 C4 Total LCIA results Global warming kg CO eq 3.41E+00 5.98E-02 7.74E-02 0 0 2.75E-02 0 3.58E-02 3.61E+00 2 Ozone depletion kg CFC-11 eq 2.74E-12 1.33E-16 1.27E-16 0 0 6.14E-17 0 1.76E-15 2.75E-12 9.51E-03 Acidification kg SO2 eq 8.78E-03 3.07E-04 1.65E-04 0 0 7.52E-05 0 1.90E-04 Eutrophication kg N eq 3.51E-03 2.63E-05 2.70E-05 0 0 7.97E-06 0 8.33E-06 3.58E-03 Smog kg O eq 1.47E-01 1.05E-02 9.74E-04 0 0 1.72E-03 0 3.46E-03 1.63E-01 3 Respiratory effects kg PM2.5 eq 5.58E-04 1.50E-05 3.88E-06 0 0 3.23E-06 0 1.46E-05 5.94E-04 Additional environmental information 100.0% Carcinogenics CTUh 97.5% 0.2% 0.1% 0.0% 0.0% 0.1% 0.0% 2.1% Non-carcinogenics CTUh 94.2% 0.4% 0.3% 0.0% 0.0% 0.2% 0.0% 4.9% 100.0% Ecotoxicity CTUe 98.6% 0.7% 0.1% 0.0% 0.0% 0.3% 0.0% 0.3% 100.0% 6.79E+00 Fossil fuel depletion MJ surplus 6.54E+00 1.12E-01 1.14E-02 0 0 5.15E-02 0 7.21E-02 Resource use indicators Renewable primary energy used 2.73E+01 MJ, LHV 2.72E+01 3.30E-02 6.62E-03 0 0 1.52E-02 0 6.71E-02 as energy carrier (fuel) Renewable primary resources with energy content used as MJ, LHV 1.11E-07 -2.73E-12 8.39E-13 0 0 -1.25E-12 0 1.34E-11 1.11E-07 material Non-renewable primary 7.57E+01 resources used as an energy MJ, LHV 7.38E+01 8.47E-01 9.13E-02 0 0 3.89E-01 0 5.73E-01 carrier (fuel) Non-renewable primary resources with energy content MJ, LHV 7.22E-07 3.37E-09 3.09E-10 0 0 1.55E-09 0 1.43E-09 7.29E-07 used as material Secondary materials kg 5.87E-01 0.00E+00 0.00E+00 0 0 0.00E+00 0 0.00E+00 5.87E-01 0.00E+00 Renewable secondary fuels MJ, LHV 0.00E+00 0.00E+00 0.00E+00 0 0 0.00E+00 0 0.00E+00 Non-renewable secondary fuels MJ, LHV 0.00E+00 0.00E+00 0.00E+00 0 0 0.00E+00 0 0.00E+00 0.00E+00 Recovered energy MJ, LHV 0.00E+00 0.00E+00 0.00E+00 0 0 0.00E+00 0 0.00E+00 0.00E+00 Use of net fresh water 3 m 1.41E+00 1.15E-04 6.95E-05 0 0 5.27E-05 0 7.10E-05 1.41E+00 resources Abiotic depletion potential, 6.11E+01 MJ, LHV 5.93E+01 8.41E-01 8.83E-02 0 0 3.87E-01 0 5.55E-01 fossil Output flows and waste category indicators 0.00E+00 Hazardous waste disposed kg 0.00E+00 0.00E+00 0.00E+00 0 0 0.00E+00 0 0.00E+00 Non-hazardous waste disposed kg 2.69E-01 0.00E+00 6.77E-02 0 0 0.00E+00 0 1.71E+00 2.05E+00 High-level radioactive waste kg 5.24E-06 2.47E-09 1.26E-09 0 0 1.13E-09 0 7.09E-09 5.25E-06 Intermediate- and low-level radioactive waste, conditioned, to kg 5.07E-03 2.08E-06 1.07E-06 0 0 9.55E-07 0 6.34E-06 5.08E-03 final repository Components for re-use kg 0.00E+00 0.00E+00 0.00E+00 0 0 0.00E+00 0 0.00E+00 0.00E+00 Materials for recycling kg 0.00E+00 0.00E+00 2.39E-01 0 0 0.00E+00 0 0.00E+00 2.39E-01 Materials for energy recovery kg 0.00E+00 0.00E+00 0.00E+00 0 0 0.00E+00 0 0.00E+00 0.00E+00 0.00E+00 Exported energy MJ, LHV 0.00E+00 0.00E+00 0.00E+00 0 0 0.00E+00 0 0.00E+00 Carbon emissions and removals Biogenic carbon removal from 8.51E-01 kg CO 8.51E-01 0.00E+00 0.00E+00 0 0 0.00E+00 0 0.00E+00 product 2 Biogenic carbon emission from kg CO 3.54E-01 0.00E+00 0.00E+00 0 0 0.00E+00 0 2.94E-03 3.57E-01 product 2 Biogenic carbon removal from kg CO 6.06E-01 0.00E+00 0.00E+00 0 0 0.00E+00 0 0.00E+00 6.06E-01 packaging 2 Biogenic carbon emission from kg CO 0.00E+00 0.00E+00 1.37E-02 0 0 0.00E+00 0 0.00E+00 1.37E-02 packaging 2 Biogenic carbon emission from 2.18E-02 kg CO 0.00E+00 0.00E+00 2.18E-02 0 0 0.00E+00 0 0.00E+00 combustion of waste 2 Calcination carbon emissions kg CO 0.00E+00 0.00E+00 0.00E+00 0 0 0.00E+00 0 0.00E+00 0.00E+00 2 0.00E+00 Carbonation carbon removals kg CO 0.00E+00 0.00E+00 0.00E+00 0 0 0.00E+00 0 0.00E+00 2 Carbon emissions from combustion of waste from non renewable sources used in production processes + kg CO 0.00E+00 0.00E+00 0.00E+00 0 0 0.00E+00 0 0.00E+00 0.00E+00 2 Carbon emissions from combustion of waste from renewable sources used in production processes FSK-faced Earthwool® Insulation Board produced in Shelbyville, IN: LCIA results, resource use, output and waste flows, and carbon emissions & removals per functional unit Parameter Unit A1-A3 A4 A5 B1-B7 C1 C2 C3 C4 Total LCIA results Global warming kg CO eq 4.60E+00 6.42E-02 8.31E-02 0 0 2.95E-02 0 3.84E-02 4.82E+00 2 1.29E-11 Ozone depletion kg CFC-11 eq 1.29E-11 1.43E-16 1.36E-16 0 0 6.59E-17 0 1.89E-15 Acidification kg SO2 eq 9.59E-03 3.29E-04 1.77E-04 0 0 8.07E-05 0 2.04E-04 1.04E-02 Eutrophication kg N eq 3.47E-03 2.82E-05 2.90E-05 0 0 8.55E-06 0 8.94E-06 3.55E-03 1.82E-01 Smog kg O eq 1.64E-01 1.13E-02 1.05E-03 0 0 1.84E-03 0 3.72E-03 3 Respiratory effects kg PM2.5 eq 5.63E-04 1.61E-05 4.17E-06 0 0 3.46E-06 0 1.57E-05 6.03E-04 Additional environmental information Carcinogenics CTUh 97.4% 0.2% 0.1% 0.0% 0.0% 0.1% 0.0% 2.1% 100.0% Non-carcinogenics CTUh 94.1% 0.4% 0.3% 0.0% 0.0% 0.2% 0.0% 5.0% 100.0% 100.0% Ecotoxicity CTUe 98.6% 0.7% 0.1% 0.0% 0.0% 0.3% 0.0% 0.3% Fossil fuel depletion MJ surplus 1.01E+01 1.20E-01 1.23E-02 0 0 5.53E-02 0 7.74E-02 1.03E+01 Resource use indicators Renewable primary energy used MJ, LHV 2.13E+01 3.54E-02 7.11E-03 0 0 1.63E-02 0 7.20E-02 2.14E+01 as energy carrier (fuel) Renewable primary resources with energy content used as MJ, LHV 1.90E-07 -2.93E-12 9.01E-13 0 0 -1.35E-12 0 1.43E-11 1.90E-07 material Non-renewable primary resources used as an energy MJ, LHV 1.01E+02 9.09E-01 9.81E-02 0 0 4.18E-01 0 6.15E-01 1.03E+02 carrier (fuel) Non-renewable primary resources with energy content MJ, LHV 5.84E-07 3.62E-09 3.32E-10 0 0 1.66E-09 0 1.53E-09 5.91E-07 used as material Secondary materials kg 6.30E-01 0.00E+00 0.00E+00 0 0 0.00E+00 0 0.00E+00 6.30E-01 Renewable secondary fuels MJ, LHV 0.00E+00 0.00E+00 0.00E+00 0 0 0.00E+00 0 0.00E+00 0.00E+00 Non-renewable secondary fuels MJ, LHV 0.00E+00 0.00E+00 0.00E+00 0 0 0.00E+00 0 0.00E+00 0.00E+00 0.00E+00 Recovered energy MJ, LHV 0.00E+00 0.00E+00 0.00E+00 0 0 0.00E+00 0 0.00E+00 Use of net fresh water 3 m 1.46E+00 1.23E-04 7.47E-05 0 0 5.65E-05 0 7.62E-05 1.46E+00 resources Abiotic depletion potential, MJ, LHV 8.50E+01 9.03E-01 9.48E-02 0 0 4.15E-01 0 5.96E-01 8.70E+01 fossil Output flows and waste category indicators Hazardous waste disposed kg 0.00E+00 0.00E+00 0.00E+00 0 0 0.00E+00 0 0.00E+00 0.00E+00 Non-hazardous waste disposed kg 2.89E-01 0.00E+00 7.27E-02 0 0 0.00E+00 0 1.84E+00 2.20E+00 5.80E-06 High-level radioactive waste kg 5.79E-06 2.65E-09 1.35E-09 0 0 1.22E-09 0 7.61E-09 Intermediate- and low-level 5.52E-03 radioactive waste, conditioned, to kg 5.51E-03 2.23E-06 1.15E-06 0 0 1.03E-06 0 6.81E-06 final repository 0.00E+00 Components for re-use kg 0.00E+00 0.00E+00 0.00E+00 0 0 0.00E+00 0 0.00E+00 Materials for recycling kg 0.00E+00 0.00E+00 2.57E-01 0 0 0.00E+00 0 0.00E+00 2.57E-01 Materials for energy recovery kg 0.00E+00 0.00E+00 0.00E+00 0 0 0.00E+00 0 0.00E+00 0.00E+00 Exported energy MJ, LHV 0.00E+00 0.00E+00 0.00E+00 0 0 0.00E+00 0 0.00E+00 0.00E+00 Carbon emissions and removals Biogenic carbon removal from kg CO 8.80E-01 0.00E+00 0.00E+00 0 0 0.00E+00 0 0.00E+00 8.80E-01 product 2 Biogenic carbon emission from 3.69E-01 kg CO 3.66E-01 0.00E+00 0.00E+00 0 0 0.00E+00 0 3.16E-03 product 2 Biogenic carbon removal from kg CO 1.25E-02 0.00E+00 0.00E+00 0 0 0.00E+00 0 0.00E+00 1.25E-02 packaging 2 Biogenic carbon emission from kg CO 0.00E+00 0.00E+00 1.47E-02 0 0 0.00E+00 0 0.00E+00 1.47E-02 packaging 2 Biogenic carbon emission from kg CO 0.00E+00 0.00E+00 2.34E-02 0 0 0.00E+00 0 0.00E+00 2.34E-02 combustion of waste 2 Calcination carbon emissions kg CO 0.00E+00 0.00E+00 0.00E+00 0 0 0.00E+00 0 0.00E+00 0.00E+00 2 Carbonation carbon removals kg CO 0.00E+00 0.00E+00 0.00E+00 0 0 0.00E+00 0 0.00E+00 0.00E+00 2 Carbon emissions from combustion of waste from non renewable sources used in production processes 0.00E+00 + kg CO 0.00E+00 0.00E+00 0.00E+00 0 0 0.00E+00 0 0.00E+00 2 Carbon emissions from combustion of waste from renewable sources used in production processes ASJ+ faced Earthwool® Insulation Board produced in Shelbyville, IN: LCIA results, resource use, output and waste flows, and carbon emissions & removals per functional unit Parameter Unit A1-A3 A4 A5 B1-B7 C1 C2 C3 C4 Total LCIA results Global warming kg CO eq 5.08E+00 6.75E-02 8.74E-02 0 0 3.10E-02 0 4.04E-02 5.31E+00 2 Ozone depletion kg CFC-11 eq 1.36E-09 1.51E-16 1.43E-16 0 0 6.93E-17 0 1.99E-15 1.36E-09 Acidification kg SO2 eq 1.09E-02 3.46E-04 1.86E-04 0 0 8.49E-05 0 2.14E-04 1.18E-02 3.86E-03 Eutrophication kg N eq 3.78E-03 2.97E-05 3.05E-05 0 0 8.99E-06 0 9.40E-06 Smog kg O eq 1.84E-01 1.19E-02 1.10E-03 0 0 1.94E-03 0 3.91E-03 2.03E-01 3 Respiratory effects kg PM2.5 eq 6.48E-04 1.69E-05 4.38E-06 0 0 3.64E-06 0 1.65E-05 6.90E-04 Additional environmental information Carcinogenics CTUh 97.5% 0.2% 0.1% 0.0% 0.0% 0.1% 0.0% 2.0% 100.0% 100.0% Non-carcinogenics CTUh 94.4% 0.4% 0.3% 0.0% 0.0% 0.2% 0.0% 4.8% Ecotoxicity CTUe 98.7% 0.7% 0.1% 0.0% 0.0% 0.3% 0.0% 0.3% 100.0% Fossil fuel depletion MJ surplus 1.11E+01 1.27E-01 1.29E-02 0 0 5.82E-02 0 8.14E-02 1.14E+01 Resource use indicators Renewable primary energy used MJ, LHV 2.40E+01 3.72E-02 7.48E-03 0 0 1.71E-02 0 7.58E-02 2.41E+01 as energy carrier (fuel) Renewable primary resources with energy content used as MJ, LHV 1.03E-05 -3.08E-12 9.47E-13 0 0 -1.42E-12 0 1.51E-11 1.03E-05 material Non-renewable primary resources used as an energy MJ, LHV 1.11E+02 9.56E-01 1.03E-01 0 0 4.39E-01 0 6.47E-01 1.13E+02 carrier (fuel) Non-renewable primary resources with energy content MJ, LHV 6.31E-07 3.81E-09 3.49E-10 0 0 1.75E-09 0 1.61E-09 6.39E-07 used as material Secondary materials kg 6.62E-01 0.00E+00 0.00E+00 0 0 0.00E+00 0 0.00E+00 6.62E-01 Renewable secondary fuels MJ, LHV 0.00E+00 0.00E+00 0.00E+00 0 0 0.00E+00 0 0.00E+00 0.00E+00 0.00E+00 Non-renewable secondary fuels MJ, LHV 0.00E+00 0.00E+00 0.00E+00 0 0 0.00E+00 0 0.00E+00 Recovered energy MJ, LHV 0.00E+00 0.00E+00 0.00E+00 0 0 0.00E+00 0 0.00E+00 0.00E+00 Use of net fresh water 3 m 1.57E+00 1.29E-04 7.85E-05 0 0 5.95E-05 0 8.02E-05 1.57E+00 resources Abiotic depletion potential, MJ, LHV 9.36E+01 9.49E-01 9.97E-02 0 0 4.36E-01 0 6.27E-01 9.57E+01 fossil Output flows and waste category indicators Hazardous waste disposed kg 0.00E+00 0.00E+00 0.00E+00 0 0 0.00E+00 0 0.00E+00 0.00E+00 2.31E+00 Non-hazardous waste disposed kg 3.04E-01 0.00E+00 7.64E-02 0 0 0.00E+00 0 1.93E+00 High-level radioactive waste kg 6.34E-06 2.78E-09 1.42E-09 0 0 1.28E-09 0 8.00E-09 6.35E-06 Intermediate- and low-level radioactive waste, conditioned, to kg 6.05E-03 2.35E-06 1.21E-06 0 0 1.08E-06 0 7.16E-06 6.06E-03 final repository Components for re-use kg 0.00E+00 0.00E+00 0.00E+00 0 0 0.00E+00 0 0.00E+00 0.00E+00 Materials for recycling kg 0.00E+00 0.00E+00 2.70E-01 0 0 0.00E+00 0 0.00E+00 2.70E-01 Materials for energy recovery kg 0.00E+00 0.00E+00 0.00E+00 0 0 0.00E+00 0 0.00E+00 0.00E+00 Exported energy MJ, LHV 0.00E+00 0.00E+00 0.00E+00 0 0 0.00E+00 0 0.00E+00 0.00E+00 Carbon emissions and removals Biogenic carbon removal from kg CO 9.46E-01 0.00E+00 0.00E+00 0 0 0.00E+00 0 0.00E+00 9.46E-01 product 2 Biogenic carbon emission from kg CO 3.93E-01 0.00E+00 0.00E+00 0 0 0.00E+00 0 3.32E-03 3.97E-01 product 2 Biogenic carbon removal from 1.32E-02 kg CO 1.32E-02 0.00E+00 0.00E+00 0 0 0.00E+00 0 0.00E+00 packaging 2 Biogenic carbon emission from kg CO 0.00E+00 0.00E+00 1.54E-02 0 0 0.00E+00 0 0.00E+00 1.54E-02 packaging 2 Biogenic carbon emission from kg CO 0.00E+00 0.00E+00 2.46E-02 0 0 0.00E+00 0 0.00E+00 2.46E-02 combustion of waste 2 Calcination carbon emissions kg CO 0.00E+00 0.00E+00 0.00E+00 0 0 0.00E+00 0 0.00E+00 0.00E+00 2 Carbonation carbon removals kg CO 0.00E+00 0.00E+00 0.00E+00 0 0 0.00E+00 0 0.00E+00 0.00E+00 2 Carbon emissions from combustion of waste from non renewable sources used in production processes + kg CO 0.00E+00 0.00E+00 0.00E+00 0 0 0.00E+00 0 0.00E+00 0.00E+00 2 Carbon emissions from combustion of waste from renewable sources used in production processes SM Transparency Report (EPD) + Material Health Overview ™ ™ EPD SUMMARY LCA Knauf Insulation, Inc. This environmental product Reference PCR One Knauf Drive 3rd-party verified declaration (EPD) was externally UL Part B: Building Envelope Thermal Shelbyville, IN 46176 verified by Harmony Environmental, Insulation v2.0 www.knaufinsulation.us Transparency Report (EPD) LLC, according to ISO 21930:2017; 317 398 4434 Regions; system boundaries UL Part A; UL Part B for Building 3rd-party verified North America; Cradle-to-grave Envelope Thermal Insulation Functional unit / ESL: Products ; and ISO 14025:2006. 2 Validity: 12/12/23 – 12/12/28 1 m installed insulation material, Harmony Environmental, LLC KNA – 12122023 – 008 packaging included, with thickness 16362 W. Briarwood Ct. that gives average thermal resistance Material Olathe, KS 66062 2 of R = 1m ·K/W over an estimated evaluation Material Health www.harmonyenviro.com SI service life (ESL) of 75 years (913) 780-3328 Self-declared LCIA methodology: TRACI 2.1 LCA software; LCI database LCA for Experts v10.7; LCA for Experts 2023 In accordance with ISO 14044 and the reference PCR, this life cycle assessment was conducted by Sustainable Minds and verified by Harmony Environmental, LLC. Public LCA: Knauf Insulation North America and Manson Insulation Products © 2023 | The SM Transparency Report [EPD]™ Program is operated by Sustainable Minds® (www.sustainableminds.com) | Privacy policy
Performance dashboard LCA & material results & interpretation How we make it greener SM Transparency Catalog Knauf Insulation Showroom Earthwool® Insulation Board LCA & material health results & interpretation Earthwool® Insulation Board Unfaced FSK faced ASJ+ faced EPD additional content Material health Evaluation programs What's in this product and why Earthwool® Insulation Board products without a facer do not contain any The Health Product Declaration® chemicals that are on the Red List. The Red List is a list of chemicals that are The HPD Open Standard provides a consistent, and transparent format to not allowed in Living Building Challenge buildings. Being Red List free is our accurately disclose the material contents and associated hazard design benchmark at Knauf. classifications for a building product. Earthwool® utilizes a bio-based binder chemistry derived from corn that is How it works formaldehyde-free (FF) and more interior friendly than phenol-formaldehyde Material ingredients are screened and categorized according to the hazards (P/F) systems. that international governmental bodies and toxicology experts have associated with them, based on two listings: The ingredients of the unfaced variant avoids the 800+ chemicals of the Living Building Challenge Red List. This is primarily because of its bio-based Authoritative lists maintained or recognized by government bodies binder adhesive chemistry known as ECOSE® Technology. ECOSE is based on Screening lists, which include chemicals that government bodies determined dextrose or high fructose corn syrup instead of phenol and formaldehyde. need further scrutiny, as well as chemical lists not recognized by any Dextrose and fructose can be used interchangeably. The ECOSE binder government body. allows the product to be validated by the UL Environment as formaldehyde- free. Formaldehyde is a Red List chemical. Assessment scope and results The Earthwool® Board ASJ+ and FSK facers do not meet Red List free because the facer contains a halogenated fire retardant (HFR). This is why we disclose the ingredients as an HPD rather than Declare used for all other Health Product Declaration® product variants. Earthwool® Insulation Board Unfaced Red List Free is our development benchmark and we constantly challenge Yes Full disclosure known hazards: ourselves on elimination of Red List chemicals. An HFR is used on the faced Based on the selected content inventory threshold: variants because the products are for exposed applications and must meet stringent fire performance requirements. We are very aware of the concerns Characterized Screened Identified associated with HFRs and continually work with vendors on this issue. At the same time, fire performance is critical and current events relating to fire GreenScreen® List Translator performance of building materials only support the importance of fire-safe Scores products. List Translator Likely Benchmark 1 / At this time, the product is landfilled at end of life. We take extended producer Benchmark 1 responsibility very seriously and have active programs to address end of life. List Translator Possible Benchmark 1 There is no option other than landfills at this time. List Translator Benchmark Unknown Benchmark 2 How we're making it healthier Benchmark 3 Benchmark 4 Knauf engages very closely with its vendors to eliminate and avoid No GS data available chemicals of concern. No competitor has as many Red List free products as Knauf Insulation. We continually reduce our environmental impacts Learn about the GreenScreen® List Translator through recycled content and optimize our products by designing them to be transformative. Total VOC Content See how we make it greener VOC Content data is not applicable for this product category. Earthwool® Insulation Board ASJ+ Yes Full disclosure known hazards: Based on the selected content inventory threshold: Characterized Screened Identified Total VOC Content VOC Content data is not applicable for this product category. Earthwool® Insulation Board FSK Yes Full disclosure known hazards: Based on the selected content inventory threshold: Characterized Screened Identified Total VOC Content VOC Content data is not applicable for this product category. References Rating systems Health Product Declaration® LEED BD+C: New Construction | v4 - LEED v4 Earthwool® Insulation Board - Unfaced Building product disclosure and optimization Earthwool® Insulation Board ASJ+ Material Ingredients Earthwool® Insulation Board FSK Credit value options 1 product each Health Product Declaration Open Standard - all versions The standard provides guidance to accurately disclose the material contents of 1. Reporting 2. Optimization 3. Supply Chain Optimization a building product using a standard, consistent, and transparent format. LEED BD+C: New Construction | v4.1 - LEED v4.1 Materials and resources Material Ingredients Credit value options 1 product each 1. Reporting 2. Optimization 3. Supply Chain Optimization Living Building Challenge Materials petals imperatives 10. Red List Free 12. Responsible Industry 13. Living Economy Sourcing WELL Building Standard® Air and Mind Features X07 Materials Transparency X08 Materials Optimization Collaborative for High Performance Schools National Criteria EQ C7.1 Material Health Disclosures Performance Approach 2 points Prescriptive Approach 2 points SM Transparency Report (EPD) + Material Health Overview ™ ™ EPD SUMMARY LCA Knauf Insulation, Inc. This environmental product One Knauf Drive 3rd-party verified declaration (EPD) was externally Reference PCR Shelbyville, IN 46176 verified by Harmony Environmental, UL Part B: Building Envelope Thermal www.knaufinsulation.us Transparency Report (EPD) LLC, according to ISO 21930:2017; Insulation v2.0 317 398 4434 UL Part A; UL Part B for Building 3rd-party verified Regions; system boundaries Envelope Thermal Insulation North America; Cradle-to-grave Products ; and ISO 14025:2006. Validity: 12/12/23 – 12/12/28 KNA – 12122023 – 008 Functional unit / ESL: Harmony Environmental, LLC 2 1 m installed insulation material, 16362 W. Briarwood Ct. Material packaging included, with thickness Olathe, KS 66062 evaluation that gives average thermal resistance Material Health www.harmonyenviro.com 2 of R = 1m ·K/W over an estimated SI Self-declared (913) 780-3328 service life (ESL) of 75 years LCIA methodology: TRACI 2.1 LCA software; LCI database LCA for Experts v10.7; LCA for Experts 2023 In accordance with ISO 14044 and the reference PCR, this life cycle assessment was conducted by Sustainable Minds and verified by Harmony Environmental, LLC. Public LCA: Knauf Insulation North America and Manson Insulation Products © 2023 | The SM Transparency Report [EPD]™ Program is operated by Sustainable Minds® (www.sustainableminds.com) | Privacy policy
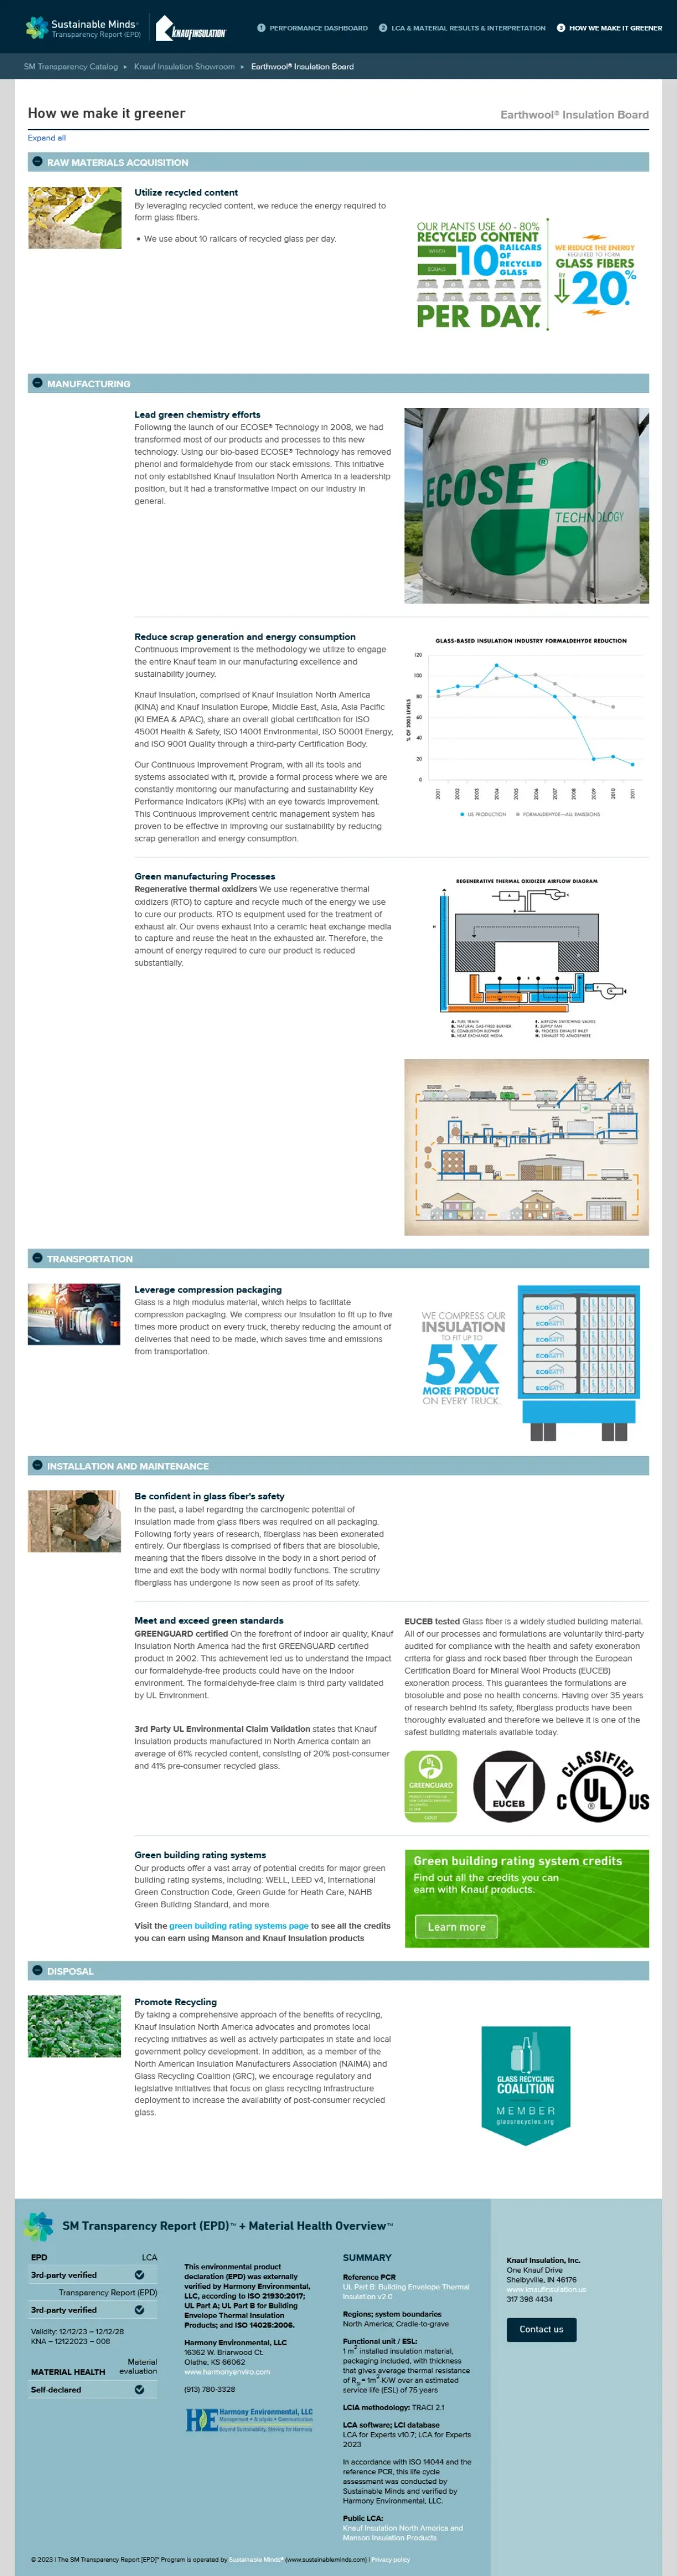
Performance dashboard LCA & material results & interpretation How we make it greener SM Transparency Catalog Knauf Insulation Showroom Earthwool® Insulation Board How we make it greener Earthwool® Insulation Board Expand all Raw materials acquisition Utilize recycled content By leveraging recycled content, we reduce the energy required to form glass fibers. We use about 10 railcars of recycled glass per day. MANUFACTURING Lead green chemistry efforts Following the launch of our ECOSE® Technology in 2008, we had transformed most of our products and processes to this new technology. Using our bio-based ECOSE® Technology has removed phenol and formaldehyde from our stack emissions. This initiative not only established Knauf Insulation North America in a leadership position, but it had a transformative impact on our industry in general. Reduce scrap generation and energy consumption Continuous improvement is the methodology we utilize to engage the entire Knauf team in our manufacturing excellence and sustainability journey. Knauf Insulation, comprised of Knauf Insulation North America (KINA) and Knauf Insulation Europe, Middle East, Asia, Asia Pacific (KI EMEA & APAC), share an overall global certification for ISO 45001 Health & Safety, ISO 14001 Environmental, ISO 50001 Energy, and ISO 9001 Quality through a third-party Certification Body. Our Continuous Improvement Program, with all its tools and systems associated with it, provide a formal process where we are constantly monitoring our manufacturing and sustainability Key Performance Indicators (KPIs) with an eye towards improvement. This Continuous Improvement centric management system has proven to be effective in improving our sustainability by reducing scrap generation and energy consumption. Green manufacturing Processes Regenerative thermal oxidizers We use regenerative thermal oxidizers (RTO) to capture and recycle much of the energy we use to cure our products. RTO is equipment used for the treatment of exhaust air. Our ovens exhaust into a ceramic heat exchange media to capture and reuse the heat in the exhausted air. Therefore, the amount of energy required to cure our product is reduced substantially. TRANSPORTATION Leverage compression packaging Glass is a high modulus material, which helps to facilitate compression packaging. We compress our insulation to fit up to five times more product on every truck, thereby reducing the amount of deliveries that need to be made, which saves time and emissions from transportation. INSTALLATION AND MAINTENANCE Be confident in glass fiber's safety In the past, a label regarding the carcinogenic potential of insulation made from glass fibers was required on all packaging. Following forty years of research, fiberglass has been exonerated entirely. Our fiberglass is comprised of fibers that are biosoluble, meaning that the fibers dissolve in the body in a short period of time and exit the body with normal bodily functions. The scrutiny fiberglass has undergone is now seen as proof of its safety. Meet and exceed green standards EUCEB tested Glass fiber is a widely studied building material. GREENGUARD certified On the forefront of indoor air quality, Knauf All of our processes and formulations are voluntarily third-party Insulation North America had the first GREENGUARD certified audited for compliance with the health and safety exoneration product in 2002. This achievement led us to understand the impact criteria for glass and rock based fiber through the European our formaldehyde-free products could have on the indoor Certification Board for Mineral Wool Products (EUCEB) environment. The formaldehyde-free claim is third party validated exoneration process. This guarantees the formulations are by UL Environment. biosoluble and pose no health concerns. Having over 35 years of research behind its safety, fiberglass products have been thoroughly evaluated and therefore we believe it is one of the 3rd Party UL Environmental Claim Validation states that Knauf safest building materials available today. Insulation products manufactured in North America contain an average of 61% recycled content, consisting of 20% post-consumer and 41% pre-consumer recycled glass. Green building rating systems Our products offer a vast array of potential credits for major green building rating systems, including: WELL, LEED v4, International Green Construction Code, Green Guide for Heath Care, NAHB Green Building Standard, and more. Visit the green building rating systems page to see all the credits you can earn using Manson and Knauf Insulation products DISPOSAL Promote Recycling By taking a comprehensive approach of the benefits of recycling, Knauf Insulation North America advocates and promotes local recycling initiatives as well as actively participates in state and local government policy development. In addition, as a member of the North American Insulation Manufacturers Association (NAIMA) and Glass Recycling Coalition (GRC), we encourage regulatory and legislative initiatives that focus on glass recycling infrastructure deployment to increase the availability of post-consumer recycled glass. SM Transparency Report (EPD) + Material Health Overview ™ ™ EPD SUMMARY LCA Knauf Insulation, Inc. This environmental product One Knauf Drive 3rd-party verified declaration (EPD) was externally Reference PCR Shelbyville, IN 46176 verified by Harmony Environmental, UL Part B: Building Envelope Thermal www.knaufinsulation.us Transparency Report (EPD) LLC, according to ISO 21930:2017; Insulation v2.0 317 398 4434 UL Part A; UL Part B for Building 3rd-party verified Regions; system boundaries Envelope Thermal Insulation North America; Cradle-to-grave Products ; and ISO 14025:2006. Validity: 12/12/23 – 12/12/28 KNA – 12122023 – 008 Functional unit / ESL: Harmony Environmental, LLC 2 1 m installed insulation material, 16362 W. Briarwood Ct. Material packaging included, with thickness Olathe, KS 66062 evaluation that gives average thermal resistance Material Health www.harmonyenviro.com 2 of R = 1m ·K/W over an estimated SI Self-declared (913) 780-3328 service life (ESL) of 75 years LCIA methodology: TRACI 2.1 LCA software; LCI database LCA for Experts v10.7; LCA for Experts 2023 In accordance with ISO 14044 and the reference PCR, this life cycle assessment was conducted by Sustainable Minds and verified by Harmony Environmental, LLC. Public LCA: Knauf Insulation North America and Manson Insulation Products © 2023 | The SM Transparency Report [EPD]™ Program is operated by Sustainable Minds® (www.sustainableminds.com) | Privacy policy
