SM Transparency Catalog Knauf Insulation Showroom Jet Stream® Ultra Blowing Wool Insulation PERFORMANCE DASHBOARDLCA & MATERIAL RESULTS & INTERPRETATIONHOW WE MAKE IT GREENERJet Stream®Ultra Blowing Wool InsulationKnauf Insulation’s Jet Stream® Ultra is anunbonded, virgin fibrous glass blowinginsulation. It utilizes a high degree of recycledcontent, and offers optimal thermalproperties, excellent coverage and blowingcharacteristics. Our blowing insulation can beinstalled in new and existing structures and isexcellent for blow-in-blanket applications. Itdense-packs in wall cavities with no settling.MasterFormat® 07 21 26Jet Stream Ultra Blowing Wool InsulationGuide Spec, Technical Data SheetFor spec help, contact us or call 317 421 8727See LCA, interpretation & rating systemsSee materials, interpretation & rating systemsFeatures & functionalityFills all gaps, creating a thermal barrier againstoutside air and reducing utility billsResists heat flow with an R-value of R-15 in 2 x4 construction and R-23 in 2 x 6 constructionContains high degree of recycled contentImproves Sound Transmission Class (STC)ratings by 4 to 10 pointsVisit Knauf for more product informationJet Stream® Ultra Blowing Wool InsulationEnvironment & materialsImproved by:Utilization of recycled glassOptimized compression packagingCertification & rating systems:Declare, Red List FreeUL GREENGUARD Gold certifiedUL Validated recycled contentUL Validated formaldehyde-freeAudited, European Certification Board for Mineral WoolProducts exoneration processASTM C764; Type IPerformance dashboardValidity: 12/12/23 – 12/12/28KNA – 12122023 – 003This environmental productdeclaration (EPD) was externallyverified by Harmony Environmental,LLC, according to ISO 21930:2017;UL Part A; UL Part B for BuildingEnvelope Thermal InsulationProducts; and ISO 14025:2006.Harmony Environmental, LLC16362 W. Briarwood Ct.Olathe, KS 66062www.harmonyenviro.com(913) 780-3328SUMMARYReference PCRUL Part B: Building Envelope ThermalInsulation v2.0Regions; system boundariesNorth America; Cradle-to-graveFunctional unit / ESL:1 m installed insulation material,packaging included, with thicknessthat gives average thermal resistanceof R = 1m ·K/W over an estimatedservice life (ESL) of 75 yearsLCIA methodology: TRACI 2.1LCA software; LCI databaseLCA for Experts v10.7; LCA for Experts2023In accordance with ISO 14044 and thereference PCR, this life cycleassessment was conducted bySustainable Minds and verified byHarmony Environmental, LLC.Public LCA:Knauf Insulation North America andManson Insulation Products SM Transparency Report (EPD) ™ + Material Health Overview ™EPDLCA3rd-party verifiedTransparency Report (EPD)3rd-party verifiedMATERIAL HEALTHMaterialevaluationSelf-declared2SI 2© 2023 | The SM Transparency Report [EPD]™ Program is operated by Sustainable Minds® (www.sustainableminds.com) | Privacy policyKnauf Insulation, Inc.One Knauf DriveShelbyville, IN 46176www.knaufinsulation.us317 398 4434Contact us
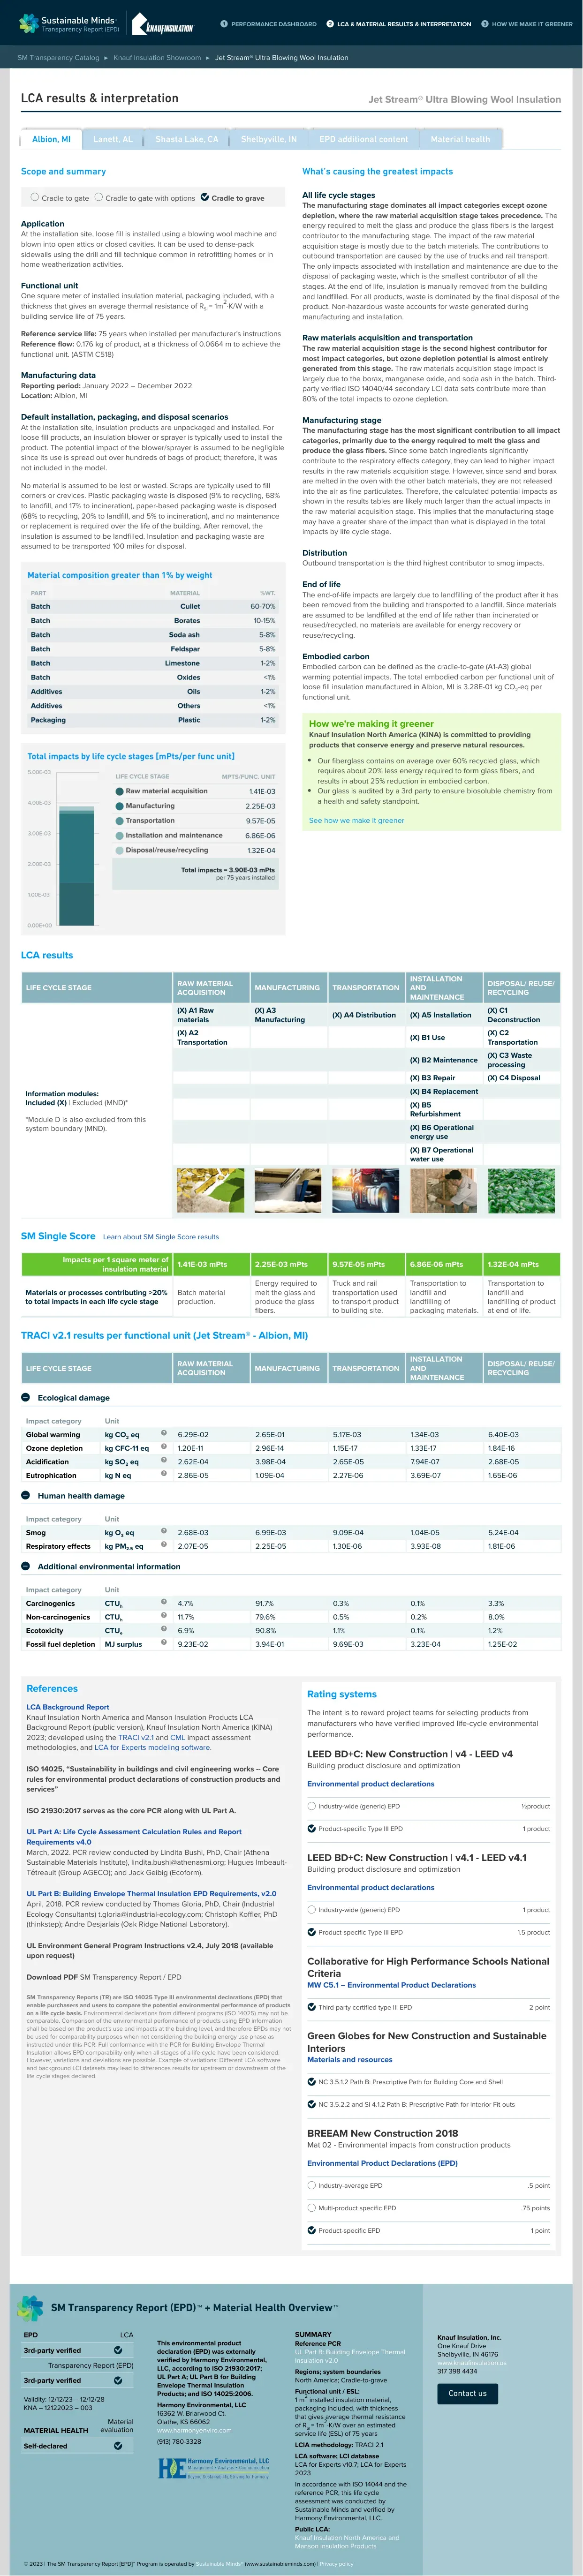
SM Transparency Catalog Knauf Insulation Showroom Jet Stream® Ultra Blowing Wool Insulation PERFORMANCE DASHBOARDLCA & MATERIAL RESULTS & INTERPRETATIONHOW WE MAKE IT GREENERJet Stream® Ultra Blowing Wool InsulationScope and summaryCradle to gate Cradle to gate with options Cradle to graveApplicationAt the installation site, loose fill is installed using a blowing wool machine andblown into open attics or closed cavities. It can be used to dense-packsidewalls using the drill and fill technique common in retrofitting homes or inhome weatherization activities.Functional unitOne square meter of installed insulation material, packaging included, with athickness that gives an average thermal resistance of R = 1m ·K/W with abuilding service life of 75 years.Reference service life: 75 years when installed per manufacturer’s instructionsReference flow: 0.176 kg of product, at a thickness of 0.0664 m to achieve thefunctional unit. (ASTM C518)Manufacturing dataReporting period: January 2022 – December 2022Location: Albion, MIDefault installation, packaging, and disposal scenariosAt the installation site, insulation products are unpackaged and installed. Forloose fill products, an insulation blower or sprayer is typically used to install theproduct. The potential impact of the blower/sprayer is assumed to be negligiblesince its use is spread out over hundreds of bags of product; therefore, it wasnot included in the model.No material is assumed to be lost or wasted. Scraps are typically used to fillcorners or crevices. Plastic packaging waste is disposed (9% to recycling, 68%to landfill, and 17% to incineration), paper-based packaging waste is disposed(68% to recycling, 20% to landfill, and 5% to incineration), and no maintenanceor replacement is required over the life of the building. After removal, theinsulation is assumed to be landfilled. Insulation and packaging waste areassumed to be transported 100 miles for disposal.What’s causing the greatest impactsAll life cycle stagesThe manufacturing stage dominates all impact categories except ozonedepletion, where the raw material acquisition stage takes precedence. Theenergy required to melt the glass and produce the glass fibers is the largestcontributor to the manufacturing stage. The impact of the raw materialacquisition stage is mostly due to the batch materials. The contributions tooutbound transportation are caused by the use of trucks and rail transport.The only impacts associated with installation and maintenance are due to thedisposal of packaging waste, which is the smallest contributor of all thestages. At the end of life, insulation is manually removed from the buildingand landfilled. For all products, waste is dominated by the final disposal of theproduct. Non-hazardous waste accounts for waste generated duringmanufacturing and installation.Raw materials acquisition and transportationThe raw material acquisition stage is the second highest contributor formost impact categories, but ozone depletion potential is almost entirelygenerated from this stage. The raw materials acquisition stage impact islargely due to the borax, manganese oxide, and soda ash in the batch. Third-party verified ISO 14040/44 secondary LCI data sets contribute more than80% of the total impacts to ozone depletion.Manufacturing stageThe manufacturing stage has the most significant contribution to all impactcategories, primarily due to the energy required to melt the glass andproduce the glass fibers. Since some batch ingredients significantlycontribute to the respiratory effects category, they can lead to higher impactresults in the raw materials acquisition stage. However, since sand and boraxare melted in the oven with the other batch materials, they are not releasedinto the air as fine particulates. Therefore, the calculated potential impacts asshown in the results tables are likely much larger than the actual impacts inthe raw material acquisition stage. This implies that the manufacturing stagemay have a greater share of the impact than what is displayed in the totalimpacts by life cycle stage.DistributionOutbound transportation is the third highest contributor to smog impacts.End of lifeThe end-of-life impacts are largely due to landfilling of the product after it hasbeen removed from the building and transported to a landfill. Since materialsare assumed to be landfilled at the end of life rather than incinerated orreused/recycled, no materials are available for energy recovery orreuse/recycling.Embodied carbonEmbodied carbon can be defined as the cradle-to-gate (A1-A3) globalwarming potential impacts. The total embodied carbon per functional unit ofloose fill insulation manufactured in Albion, MI is 3.28E-01 kg CO -eq perfunctional unit.How we're making it greenerKnauf Insulation North America (KINA) is committed to providingproducts that conserve energy and preserve natural resources.Our fiberglass contains on average over 60% recycled glass, whichrequires about 20% less energy required to form glass fibers, andresults in about 25% reduction in embodied carbon.Our glass is audited by a 3rd party to ensure biosoluble chemistry froma health and safety standpoint.See how we make it greenerReferencesLCA Background ReportKnauf Insulation North America and Manson Insulation Products LCABackground Report (public version), Knauf Insulation North America (KINA)2023; developed using the TRACI v2.1 and CML impact assessmentmethodologies, and LCA for Experts modeling software.ISO 14025, “Sustainability in buildings and civil engineering works -- Corerules for environmental product declarations of construction products andservices”ISO 21930:2017 serves as the core PCR along with UL Part A.UL Part A: Life Cycle Assessment Calculation Rules and ReportRequirements v4.0March, 2022. PCR review conducted by Lindita Bushi, PhD, Chair (AthenaSustainable Materials Institute), lindita.bushi@athenasmi.org; Hugues Imbeault-Tétreault (Group AGECO); and Jack Geibig (Ecoform).UL Part B: Building Envelope Thermal Insulation EPD Requirements, v2.0April, 2018. PCR review conducted by Thomas Gloria, PhD, Chair (IndustrialEcology Consultants) t.gloria@industrial-ecology.com; Christoph Koffler, PhD(thinkstep); Andre Desjarlais (Oak Ridge National Laboratory).UL Environment General Program Instructions v2.4, July 2018 (availableupon request)Download PDF SM Transparency Report / EPDSM Transparency Reports (TR) are ISO 14025 Type III environmental declarations (EPD) thatenable purchasers and users to compare the potential environmental performance of productson a life cycle basis. Environmental declarations from different programs (ISO 14025) may not becomparable. Comparison of the environmental performance of products using EPD informationshall be based on the product’s use and impacts at the building level, and therefore EPDs may notbe used for comparability purposes when not considering the building energy use phase asinstructed under this PCR. Full conformance with the PCR for Building Envelope ThermalInsulation allows EPD comparability only when all stages of a life cycle have been considered.However, variations and deviations are possible. Example of variations: Different LCA softwareand background LCI datasets may lead to differences results for upstream or downstream of thelife cycle stages declared.Rating systemsThe intent is to reward project teams for selecting products frommanufacturers who have verified improved life-cycle environmentalperformance.LEED BD+C: New Construction | v4 - LEED v4Building product disclosure and optimizationEnvironmental product declarations½productIndustry-wide (generic) EPD1 productProduct-specific Type III EPDLEED BD+C: New Construction | v4.1 - LEED v4.1Building product disclosure and optimizationEnvironmental product declarations1 productIndustry-wide (generic) EPD1.5 productProduct-specific Type III EPDCollaborative for High Performance Schools NationalCriteriaMW C5.1 – Environmental Product Declarations2 pointThird-party certified type III EPDGreen Globes for New Construction and SustainableInteriorsMaterials and resourcesNC 3.5.1.2 Path B: Prescriptive Path for Building Core and ShellNC 3.5.2.2 and SI 4.1.2 Path B: Prescriptive Path for Interior Fit-outsBREEAM New Construction 2018Mat 02 - Environmental impacts from construction productsEnvironmental Product Declarations (EPD).5 pointIndustry-average EPD.75 pointsMulti-product specific EPD1 pointProduct-specific EPDLCA results & interpretationLCA resultsLIFE CYCLE STAGERAW MATERIALACQUISITIONMANUFACTURINGTRANSPORTATIONINSTALLATIONANDMAINTENANCEDISPOSAL/ REUSE/RECYCLINGInformation modules:Included (X) | Excluded (MND)**Module D is also excluded from thissystem boundary (MND).(X) A1 Rawmaterials(X) A3Manufacturing(X) A4 Distribution(X) A5 Installation(X) C1Deconstruction(X) A2Transportation (X) B1 Use(X) C2Transportation (X) B2 Maintenance(X) C3 Wasteprocessing (X) B3 Repair(X) C4 Disposal (X) B4 Replacement (X) B5Refurbishment (X) B6 Operationalenergy use (X) B7 Operationalwater use SM Single Score Learn about SM Single Score resultsImpacts per 1 square meter ofinsulation material1.41E-03 mPts2.25E-03 mPts9.57E-05 mPts6.86E-06 mPts1.32E-04 mPtsMaterials or processes contributing >20%to total impacts in each life cycle stageBatch materialproduction.Energy required tomelt the glass andproduce the glassfibers.Truck and railtransportation usedto transport productto building site.Transportation tolandfill andlandfilling ofpackaging materials.Transportation tolandfill andlandfilling of productat end of life.TRACI v2.1 results per functional unit (Jet Stream® - Albion, MI)LIFE CYCLE STAGERAW MATERIALACQUISITIONMANUFACTURINGTRANSPORTATIONINSTALLATIONANDMAINTENANCEDISPOSAL/ REUSE/RECYCLINGEcological damageImpact categoryUnitGlobal warmingkg CO eq6.29E-022.65E-015.17E-031.34E-036.40E-03Ozone depletionkg CFC-11 eq1.20E-112.96E-141.15E-171.33E-171.84E-16Acidificationkg SO eq2.62E-043.98E-042.65E-057.94E-072.68E-05Eutrophicationkg N eq2.86E-051.09E-042.27E-063.69E-071.65E-06Human health damageImpact categoryUnitSmogkg O eq2.68E-036.99E-039.09E-041.04E-055.24E-04Respiratory effectskg PM eq2.07E-052.25E-051.30E-063.93E-081.81E-06Additional environmental informationImpact categoryUnitCarcinogenicsCTU4.7%91.7%0.3%0.1%3.3%Non-carcinogenicsCTU11.7%79.6%0.5%0.2%8.0%EcotoxicityCTU6.9%90.8%1.1%0.1%1.2%Fossil fuel depletionMJ surplus9.23E-023.94E-019.69E-033.23E-041.25E-02 Lanett, ALShasta Lake, CAShelbyville, INEPD additional contentMaterial healthSI 222232.5hheValidity: 12/12/23 – 12/12/28KNA – 12122023 – 003This environmental productdeclaration (EPD) was externallyverified by Harmony Environmental,LLC, according to ISO 21930:2017;UL Part A; UL Part B for BuildingEnvelope Thermal InsulationProducts; and ISO 14025:2006.Harmony Environmental, LLC16362 W. Briarwood Ct.Olathe, KS 66062www.harmonyenviro.com(913) 780-3328SUMMARYReference PCRUL Part B: Building Envelope ThermalInsulation v2.0Regions; system boundariesNorth America; Cradle-to-graveFunctional unit / ESL:1 m installed insulation material,packaging included, with thicknessthat gives average thermal resistanceof R = 1m ·K/W over an estimatedservice life (ESL) of 75 yearsLCIA methodology: TRACI 2.1LCA software; LCI databaseLCA for Experts v10.7; LCA for Experts2023In accordance with ISO 14044 and thereference PCR, this life cycleassessment was conducted bySustainable Minds and verified byHarmony Environmental, LLC.Public LCA:Knauf Insulation North America andManson Insulation Products SM Transparency Report (EPD) ™ + Material Health Overview ™EPDLCA3rd-party verifiedTransparency Report (EPD)3rd-party verifiedMATERIAL HEALTHMaterialevaluationSelf-declared2SI 2© 2023 | The SM Transparency Report [EPD]™ Program is operated by Sustainable Minds® (www.sustainableminds.com) | Privacy policyKnauf Insulation, Inc.One Knauf DriveShelbyville, IN 46176www.knaufinsulation.us317 398 4434Contact usAlbion, MI
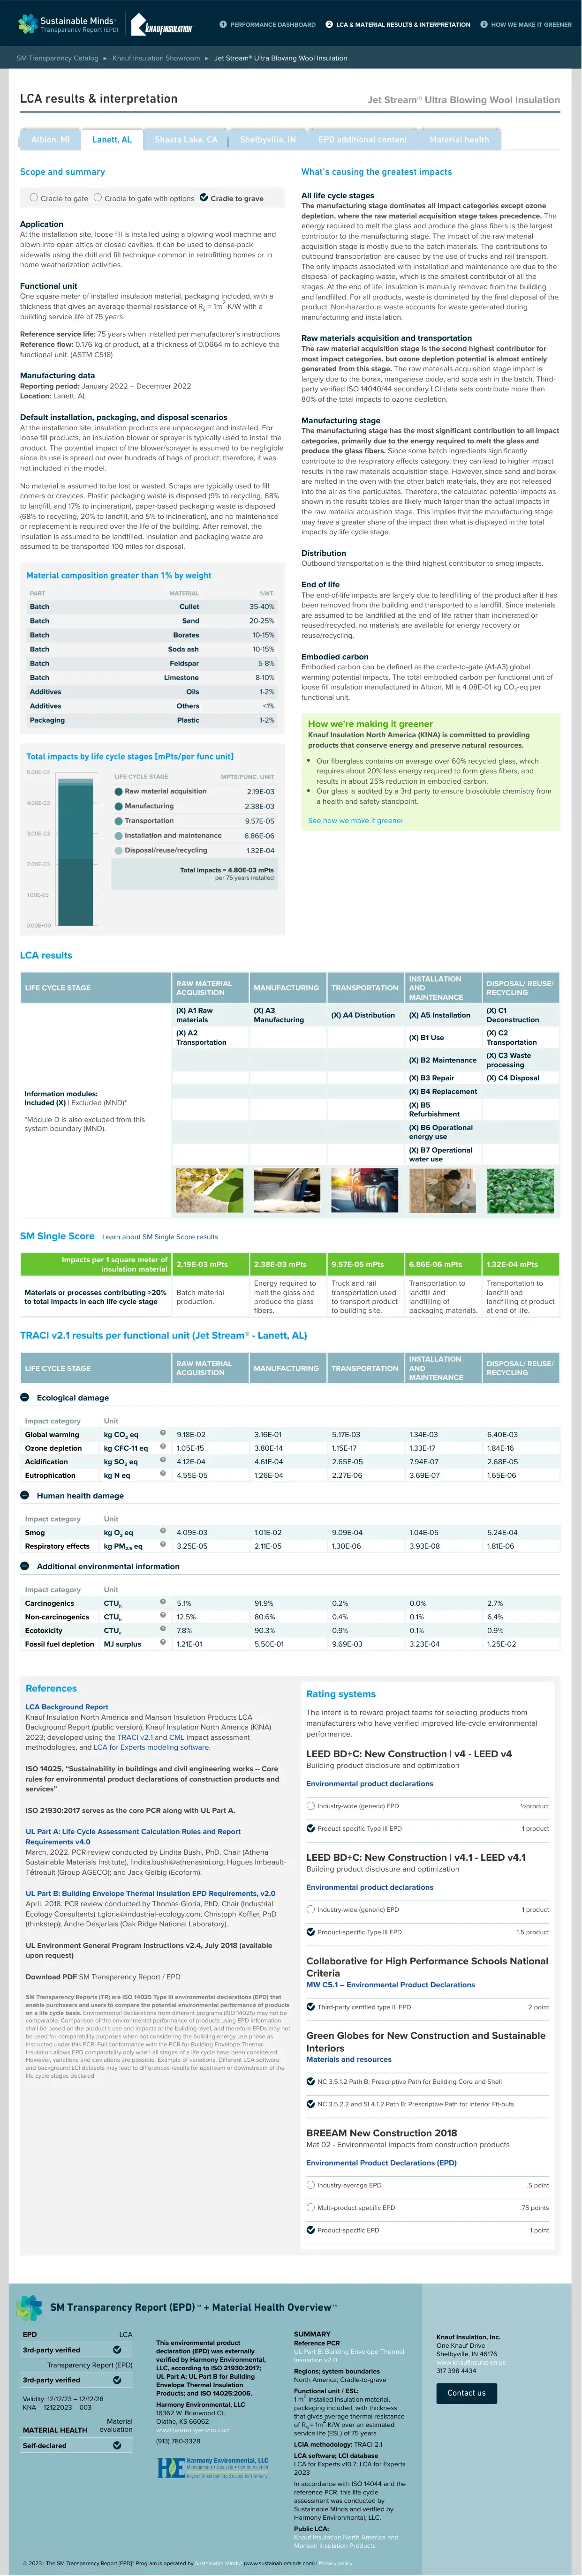
SM Transparency Catalog Knauf Insulation Showroom Jet Stream® Ultra Blowing Wool Insulation PERFORMANCE DASHBOARDLCA & MATERIAL RESULTS & INTERPRETATIONHOW WE MAKE IT GREENERJet Stream® Ultra Blowing Wool InsulationScope and summaryCradle to gate Cradle to gate with options Cradle to graveApplicationAt the installation site, loose fill is installed using a blowing wool machine andblown into open attics or closed cavities. It can be used to dense-packsidewalls using the drill and fill technique common in retrofitting homes or inhome weatherization activities.Functional unitOne square meter of installed insulation material, packaging included, with athickness that gives an average thermal resistance of R = 1m ·K/W with abuilding service life of 75 years.Reference service life: 75 years when installed per manufacturer’s instructionsReference flow: 0.176 kg of product, at a thickness of 0.0664 m to achieve thefunctional unit. (ASTM C518)Manufacturing dataReporting period: January 2022 – December 2022Location: Lanett, ALDefault installation, packaging, and disposal scenariosAt the installation site, insulation products are unpackaged and installed. Forloose fill products, an insulation blower or sprayer is typically used to install theproduct. The potential impact of the blower/sprayer is assumed to be negligiblesince its use is spread out over hundreds of bags of product; therefore, it wasnot included in the model.No material is assumed to be lost or wasted. Scraps are typically used to fillcorners or crevices. Plastic packaging waste is disposed (9% to recycling, 68%to landfill, and 17% to incineration), paper-based packaging waste is disposed(68% to recycling, 20% to landfill, and 5% to incineration), and no maintenanceor replacement is required over the life of the building. After removal, theinsulation is assumed to be landfilled. Insulation and packaging waste areassumed to be transported 100 miles for disposal.What’s causing the greatest impactsAll life cycle stagesThe manufacturing stage dominates all impact categories except ozonedepletion, where the raw material acquisition stage takes precedence. Theenergy required to melt the glass and produce the glass fibers is the largestcontributor to the manufacturing stage. The impact of the raw materialacquisition stage is mostly due to the batch materials. The contributions tooutbound transportation are caused by the use of trucks and rail transport.The only impacts associated with installation and maintenance are due to thedisposal of packaging waste, which is the smallest contributor of all thestages. At the end of life, insulation is manually removed from the buildingand landfilled. For all products, waste is dominated by the final disposal of theproduct. Non-hazardous waste accounts for waste generated duringmanufacturing and installation.Raw materials acquisition and transportationThe raw material acquisition stage is the second highest contributor formost impact categories, but ozone depletion potential is almost entirelygenerated from this stage. The raw materials acquisition stage impact islargely due to the borax, manganese oxide, and soda ash in the batch. Third-party verified ISO 14040/44 secondary LCI data sets contribute more than80% of the total impacts to ozone depletion.Manufacturing stageThe manufacturing stage has the most significant contribution to all impactcategories, primarily due to the energy required to melt the glass andproduce the glass fibers. Since some batch ingredients significantlycontribute to the respiratory effects category, they can lead to higher impactresults in the raw materials acquisition stage. However, since sand and boraxare melted in the oven with the other batch materials, they are not releasedinto the air as fine particulates. Therefore, the calculated potential impacts asshown in the results tables are likely much larger than the actual impacts inthe raw material acquisition stage. This implies that the manufacturing stagemay have a greater share of the impact than what is displayed in the totalimpacts by life cycle stage.DistributionOutbound transportation is the third highest contributor to smog impacts.End of lifeThe end-of-life impacts are largely due to landfilling of the product after it hasbeen removed from the building and transported to a landfill. Since materialsare assumed to be landfilled at the end of life rather than incinerated orreused/recycled, no materials are available for energy recovery orreuse/recycling.Embodied carbonEmbodied carbon can be defined as the cradle-to-gate (A1-A3) globalwarming potential impacts. The total embodied carbon per functional unit ofloose fill insulation manufactured in Albion, MI is 4.08E-01 kg CO -eq perfunctional unit.How we're making it greenerKnauf Insulation North America (KINA) is committed to providingproducts that conserve energy and preserve natural resources.Our fiberglass contains on average over 60% recycled glass, whichrequires about 20% less energy required to form glass fibers, andresults in about 25% reduction in embodied carbon.Our glass is audited by a 3rd party to ensure biosoluble chemistry froma health and safety standpoint.See how we make it greenerReferencesLCA Background ReportKnauf Insulation North America and Manson Insulation Products LCABackground Report (public version), Knauf Insulation North America (KINA)2023; developed using the TRACI v2.1 and CML impact assessmentmethodologies, and LCA for Experts modeling software.ISO 14025, “Sustainability in buildings and civil engineering works -- Corerules for environmental product declarations of construction products andservices”ISO 21930:2017 serves as the core PCR along with UL Part A.UL Part A: Life Cycle Assessment Calculation Rules and ReportRequirements v4.0March, 2022. PCR review conducted by Lindita Bushi, PhD, Chair (AthenaSustainable Materials Institute), lindita.bushi@athenasmi.org; Hugues Imbeault-Tétreault (Group AGECO); and Jack Geibig (Ecoform).UL Part B: Building Envelope Thermal Insulation EPD Requirements, v2.0April, 2018. PCR review conducted by Thomas Gloria, PhD, Chair (IndustrialEcology Consultants) t.gloria@industrial-ecology.com; Christoph Koffler, PhD(thinkstep); Andre Desjarlais (Oak Ridge National Laboratory).UL Environment General Program Instructions v2.4, July 2018 (availableupon request)Download PDF SM Transparency Report / EPDSM Transparency Reports (TR) are ISO 14025 Type III environmental declarations (EPD) thatenable purchasers and users to compare the potential environmental performance of productson a life cycle basis. Environmental declarations from different programs (ISO 14025) may not becomparable. Comparison of the environmental performance of products using EPD informationshall be based on the product’s use and impacts at the building level, and therefore EPDs may notbe used for comparability purposes when not considering the building energy use phase asinstructed under this PCR. Full conformance with the PCR for Building Envelope ThermalInsulation allows EPD comparability only when all stages of a life cycle have been considered.However, variations and deviations are possible. Example of variations: Different LCA softwareand background LCI datasets may lead to differences results for upstream or downstream of thelife cycle stages declared.Rating systemsThe intent is to reward project teams for selecting products frommanufacturers who have verified improved life-cycle environmentalperformance.LEED BD+C: New Construction | v4 - LEED v4Building product disclosure and optimizationEnvironmental product declarations½productIndustry-wide (generic) EPD1 productProduct-specific Type III EPDLEED BD+C: New Construction | v4.1 - LEED v4.1Building product disclosure and optimizationEnvironmental product declarations1 productIndustry-wide (generic) EPD1.5 productProduct-specific Type III EPDCollaborative for High Performance Schools NationalCriteriaMW C5.1 – Environmental Product Declarations2 pointThird-party certified type III EPDGreen Globes for New Construction and SustainableInteriorsMaterials and resourcesNC 3.5.1.2 Path B: Prescriptive Path for Building Core and ShellNC 3.5.2.2 and SI 4.1.2 Path B: Prescriptive Path for Interior Fit-outsBREEAM New Construction 2018Mat 02 - Environmental impacts from construction productsEnvironmental Product Declarations (EPD).5 pointIndustry-average EPD.75 pointsMulti-product specific EPD1 pointProduct-specific EPDLCA results & interpretationLCA resultsLIFE CYCLE STAGERAW MATERIALACQUISITIONMANUFACTURINGTRANSPORTATIONINSTALLATIONANDMAINTENANCEDISPOSAL/ REUSE/RECYCLINGInformation modules:Included (X) | Excluded (MND)**Module D is also excluded from thissystem boundary (MND).(X) A1 Rawmaterials(X) A3Manufacturing(X) A4 Distribution(X) A5 Installation(X) C1Deconstruction(X) A2Transportation (X) B1 Use(X) C2Transportation (X) B2 Maintenance(X) C3 Wasteprocessing (X) B3 Repair(X) C4 Disposal (X) B4 Replacement (X) B5Refurbishment (X) B6 Operationalenergy use (X) B7 Operationalwater use SM Single Score Learn about SM Single Score resultsImpacts per 1 square meter ofinsulation material2.19E-03 mPts2.38E-03 mPts9.57E-05 mPts6.86E-06 mPts1.32E-04 mPtsMaterials or processes contributing >20%to total impacts in each life cycle stageBatch materialproduction.Energy required tomelt the glass andproduce the glassfibers.Truck and railtransportation usedto transport productto building site.Transportation tolandfill andlandfilling ofpackaging materials.Transportation tolandfill andlandfilling of productat end of life.TRACI v2.1 results per functional unit (Jet Stream® - Lanett, AL)LIFE CYCLE STAGERAW MATERIALACQUISITIONMANUFACTURINGTRANSPORTATIONINSTALLATIONANDMAINTENANCEDISPOSAL/ REUSE/RECYCLINGEcological damageImpact categoryUnitGlobal warmingkg CO eq9.18E-023.16E-015.17E-031.34E-036.40E-03Ozone depletionkg CFC-11 eq1.05E-153.80E-141.15E-171.33E-171.84E-16Acidificationkg SO eq4.12E-044.61E-042.65E-057.94E-072.68E-05Eutrophicationkg N eq4.55E-051.26E-042.27E-063.69E-071.65E-06Human health damageImpact categoryUnitSmogkg O eq4.09E-031.01E-029.09E-041.04E-055.24E-04Respiratory effectskg PM eq3.25E-052.11E-051.30E-063.93E-081.81E-06Additional environmental informationImpact categoryUnitCarcinogenicsCTU5.1%91.9%0.2%0.0%2.7%Non-carcinogenicsCTU12.5%80.6%0.4%0.1%6.4%EcotoxicityCTU7.8%90.3%0.9%0.1%0.9%Fossil fuel depletionMJ surplus1.21E-015.50E-019.69E-033.23E-041.25E-02 Albion, MIShasta Lake, CAShelbyville, INEPD additional contentMaterial healthSI 222232.5hheValidity: 12/12/23 – 12/12/28KNA – 12122023 – 003This environmental productdeclaration (EPD) was externallyverified by Harmony Environmental,LLC, according to ISO 21930:2017;UL Part A; UL Part B for BuildingEnvelope Thermal InsulationProducts; and ISO 14025:2006.Harmony Environmental, LLC16362 W. Briarwood Ct.Olathe, KS 66062www.harmonyenviro.com(913) 780-3328SUMMARYReference PCRUL Part B: Building Envelope ThermalInsulation v2.0Regions; system boundariesNorth America; Cradle-to-graveFunctional unit / ESL:1 m installed insulation material,packaging included, with thicknessthat gives average thermal resistanceof R = 1m ·K/W over an estimatedservice life (ESL) of 75 yearsLCIA methodology: TRACI 2.1LCA software; LCI databaseLCA for Experts v10.7; LCA for Experts2023In accordance with ISO 14044 and thereference PCR, this life cycleassessment was conducted bySustainable Minds and verified byHarmony Environmental, LLC.Public LCA:Knauf Insulation North America andManson Insulation Products SM Transparency Report (EPD) ™ + Material Health Overview ™EPDLCA3rd-party verifiedTransparency Report (EPD)3rd-party verifiedMATERIAL HEALTHMaterialevaluationSelf-declared2SI 2© 2023 | The SM Transparency Report [EPD]™ Program is operated by Sustainable Minds® (www.sustainableminds.com) | Privacy policyKnauf Insulation, Inc.One Knauf DriveShelbyville, IN 46176www.knaufinsulation.us317 398 4434Contact usLanett, AL
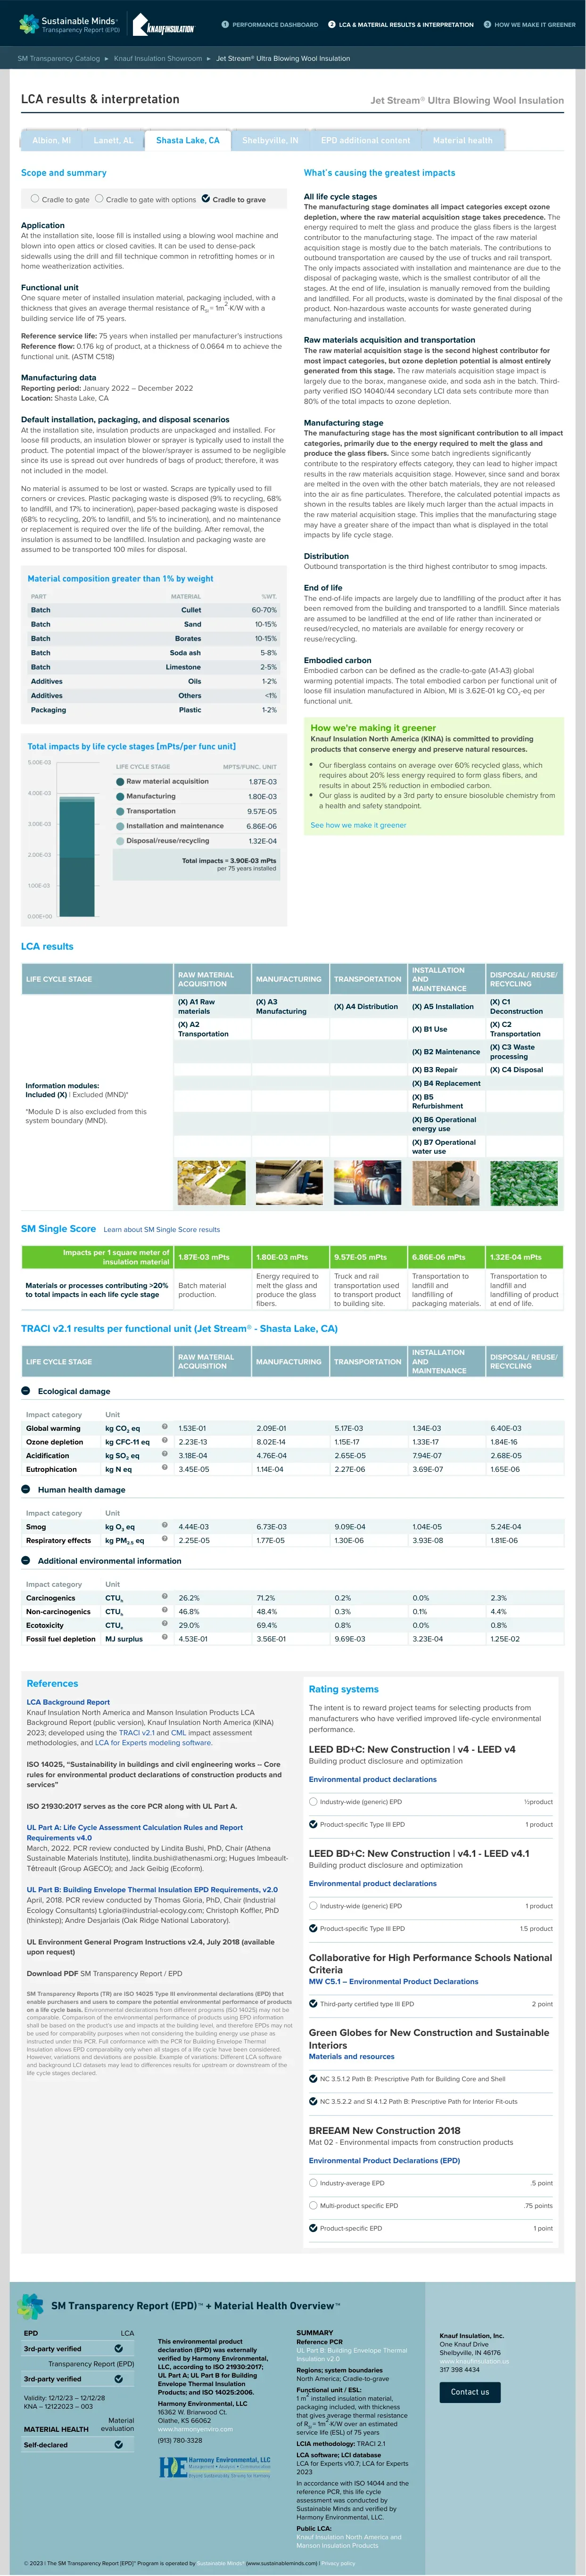
SM Transparency Catalog Knauf Insulation Showroom Jet Stream® Ultra Blowing Wool Insulation PERFORMANCE DASHBOARDLCA & MATERIAL RESULTS & INTERPRETATIONHOW WE MAKE IT GREENERJet Stream® Ultra Blowing Wool InsulationScope and summaryCradle to gate Cradle to gate with options Cradle to graveApplicationAt the installation site, loose fill is installed using a blowing wool machine andblown into open attics or closed cavities. It can be used to dense-packsidewalls using the drill and fill technique common in retrofitting homes or inhome weatherization activities.Functional unitOne square meter of installed insulation material, packaging included, with athickness that gives an average thermal resistance of R = 1m ·K/W with abuilding service life of 75 years.Reference service life: 75 years when installed per manufacturer’s instructionsReference flow: 0.176 kg of product, at a thickness of 0.0664 m to achieve thefunctional unit. (ASTM C518)Manufacturing dataReporting period: January 2022 – December 2022Location: Shasta Lake, CADefault installation, packaging, and disposal scenariosAt the installation site, insulation products are unpackaged and installed. Forloose fill products, an insulation blower or sprayer is typically used to install theproduct. The potential impact of the blower/sprayer is assumed to be negligiblesince its use is spread out over hundreds of bags of product; therefore, it wasnot included in the model.No material is assumed to be lost or wasted. Scraps are typically used to fillcorners or crevices. Plastic packaging waste is disposed (9% to recycling, 68%to landfill, and 17% to incineration), paper-based packaging waste is disposed(68% to recycling, 20% to landfill, and 5% to incineration), and no maintenanceor replacement is required over the life of the building. After removal, theinsulation is assumed to be landfilled. Insulation and packaging waste areassumed to be transported 100 miles for disposal.What’s causing the greatest impactsAll life cycle stagesThe manufacturing stage dominates all impact categories except ozonedepletion, where the raw material acquisition stage takes precedence. Theenergy required to melt the glass and produce the glass fibers is the largestcontributor to the manufacturing stage. The impact of the raw materialacquisition stage is mostly due to the batch materials. The contributions tooutbound transportation are caused by the use of trucks and rail transport.The only impacts associated with installation and maintenance are due to thedisposal of packaging waste, which is the smallest contributor of all thestages. At the end of life, insulation is manually removed from the buildingand landfilled. For all products, waste is dominated by the final disposal of theproduct. Non-hazardous waste accounts for waste generated duringmanufacturing and installation.Raw materials acquisition and transportationThe raw material acquisition stage is the second highest contributor formost impact categories, but ozone depletion potential is almost entirelygenerated from this stage. The raw materials acquisition stage impact islargely due to the borax, manganese oxide, and soda ash in the batch. Third-party verified ISO 14040/44 secondary LCI data sets contribute more than80% of the total impacts to ozone depletion.Manufacturing stageThe manufacturing stage has the most significant contribution to all impactcategories, primarily due to the energy required to melt the glass andproduce the glass fibers. Since some batch ingredients significantlycontribute to the respiratory effects category, they can lead to higher impactresults in the raw materials acquisition stage. However, since sand and boraxare melted in the oven with the other batch materials, they are not releasedinto the air as fine particulates. Therefore, the calculated potential impacts asshown in the results tables are likely much larger than the actual impacts inthe raw material acquisition stage. This implies that the manufacturing stagemay have a greater share of the impact than what is displayed in the totalimpacts by life cycle stage.DistributionOutbound transportation is the third highest contributor to smog impacts.End of lifeThe end-of-life impacts are largely due to landfilling of the product after it hasbeen removed from the building and transported to a landfill. Since materialsare assumed to be landfilled at the end of life rather than incinerated orreused/recycled, no materials are available for energy recovery orreuse/recycling.Embodied carbonEmbodied carbon can be defined as the cradle-to-gate (A1-A3) globalwarming potential impacts. The total embodied carbon per functional unit ofloose fill insulation manufactured in Albion, MI is 3.62E-01 kg CO -eq perfunctional unit.How we're making it greenerKnauf Insulation North America (KINA) is committed to providingproducts that conserve energy and preserve natural resources.Our fiberglass contains on average over 60% recycled glass, whichrequires about 20% less energy required to form glass fibers, andresults in about 25% reduction in embodied carbon.Our glass is audited by a 3rd party to ensure biosoluble chemistry froma health and safety standpoint.See how we make it greenerReferencesLCA Background ReportKnauf Insulation North America and Manson Insulation Products LCABackground Report (public version), Knauf Insulation North America (KINA)2023; developed using the TRACI v2.1 and CML impact assessmentmethodologies, and LCA for Experts modeling software.ISO 14025, “Sustainability in buildings and civil engineering works -- Corerules for environmental product declarations of construction products andservices”ISO 21930:2017 serves as the core PCR along with UL Part A.UL Part A: Life Cycle Assessment Calculation Rules and ReportRequirements v4.0March, 2022. PCR review conducted by Lindita Bushi, PhD, Chair (AthenaSustainable Materials Institute), lindita.bushi@athenasmi.org; Hugues Imbeault-Tétreault (Group AGECO); and Jack Geibig (Ecoform).UL Part B: Building Envelope Thermal Insulation EPD Requirements, v2.0April, 2018. PCR review conducted by Thomas Gloria, PhD, Chair (IndustrialEcology Consultants) t.gloria@industrial-ecology.com; Christoph Koffler, PhD(thinkstep); Andre Desjarlais (Oak Ridge National Laboratory).UL Environment General Program Instructions v2.4, July 2018 (availableupon request)Download PDF SM Transparency Report / EPDSM Transparency Reports (TR) are ISO 14025 Type III environmental declarations (EPD) thatenable purchasers and users to compare the potential environmental performance of productson a life cycle basis. Environmental declarations from different programs (ISO 14025) may not becomparable. Comparison of the environmental performance of products using EPD informationshall be based on the product’s use and impacts at the building level, and therefore EPDs may notbe used for comparability purposes when not considering the building energy use phase asinstructed under this PCR. Full conformance with the PCR for Building Envelope ThermalInsulation allows EPD comparability only when all stages of a life cycle have been considered.However, variations and deviations are possible. Example of variations: Different LCA softwareand background LCI datasets may lead to differences results for upstream or downstream of thelife cycle stages declared.Rating systemsThe intent is to reward project teams for selecting products frommanufacturers who have verified improved life-cycle environmentalperformance.LEED BD+C: New Construction | v4 - LEED v4Building product disclosure and optimizationEnvironmental product declarations½productIndustry-wide (generic) EPD1 productProduct-specific Type III EPDLEED BD+C: New Construction | v4.1 - LEED v4.1Building product disclosure and optimizationEnvironmental product declarations1 productIndustry-wide (generic) EPD1.5 productProduct-specific Type III EPDCollaborative for High Performance Schools NationalCriteriaMW C5.1 – Environmental Product Declarations2 pointThird-party certified type III EPDGreen Globes for New Construction and SustainableInteriorsMaterials and resourcesNC 3.5.1.2 Path B: Prescriptive Path for Building Core and ShellNC 3.5.2.2 and SI 4.1.2 Path B: Prescriptive Path for Interior Fit-outsBREEAM New Construction 2018Mat 02 - Environmental impacts from construction productsEnvironmental Product Declarations (EPD).5 pointIndustry-average EPD.75 pointsMulti-product specific EPD1 pointProduct-specific EPDLCA results & interpretationLCA resultsLIFE CYCLE STAGERAW MATERIALACQUISITIONMANUFACTURINGTRANSPORTATIONINSTALLATIONANDMAINTENANCEDISPOSAL/ REUSE/RECYCLINGInformation modules:Included (X) | Excluded (MND)**Module D is also excluded from thissystem boundary (MND).(X) A1 Rawmaterials(X) A3Manufacturing(X) A4 Distribution(X) A5 Installation(X) C1Deconstruction(X) A2Transportation (X) B1 Use(X) C2Transportation (X) B2 Maintenance(X) C3 Wasteprocessing (X) B3 Repair(X) C4 Disposal (X) B4 Replacement (X) B5Refurbishment (X) B6 Operationalenergy use (X) B7 Operationalwater use SM Single Score Learn about SM Single Score resultsImpacts per 1 square meter ofinsulation material1.87E-03 mPts1.80E-03 mPts9.57E-05 mPts6.86E-06 mPts1.32E-04 mPtsMaterials or processes contributing >20%to total impacts in each life cycle stageBatch materialproduction.Energy required tomelt the glass andproduce the glassfibers.Truck and railtransportation usedto transport productto building site.Transportation tolandfill andlandfilling ofpackaging materials.Transportation tolandfill andlandfilling of productat end of life.TRACI v2.1 results per functional unit (Jet Stream® - Shasta Lake, CA)LIFE CYCLE STAGERAW MATERIALACQUISITIONMANUFACTURINGTRANSPORTATIONINSTALLATIONANDMAINTENANCEDISPOSAL/ REUSE/RECYCLINGEcological damageImpact categoryUnitGlobal warmingkg CO eq1.53E-012.09E-015.17E-031.34E-036.40E-03Ozone depletionkg CFC-11 eq2.23E-138.02E-141.15E-171.33E-171.84E-16Acidificationkg SO eq3.18E-044.76E-042.65E-057.94E-072.68E-05Eutrophicationkg N eq3.45E-051.14E-042.27E-063.69E-071.65E-06Human health damageImpact categoryUnitSmogkg O eq4.44E-036.73E-039.09E-041.04E-055.24E-04Respiratory effectskg PM eq2.25E-051.77E-051.30E-063.93E-081.81E-06Additional environmental informationImpact categoryUnitCarcinogenicsCTU26.2%71.2%0.2%0.0%2.3%Non-carcinogenicsCTU46.8%48.4%0.3%0.1%4.4%EcotoxicityCTU29.0%69.4%0.8%0.0%0.8%Fossil fuel depletionMJ surplus4.53E-013.56E-019.69E-033.23E-041.25E-02 Albion, MILanett, ALShelbyville, INEPD additional contentMaterial healthSI 222232.5hheValidity: 12/12/23 – 12/12/28KNA – 12122023 – 003This environmental productdeclaration (EPD) was externallyverified by Harmony Environmental,LLC, according to ISO 21930:2017;UL Part A; UL Part B for BuildingEnvelope Thermal InsulationProducts; and ISO 14025:2006.Harmony Environmental, LLC16362 W. Briarwood Ct.Olathe, KS 66062www.harmonyenviro.com(913) 780-3328SUMMARYReference PCRUL Part B: Building Envelope ThermalInsulation v2.0Regions; system boundariesNorth America; Cradle-to-graveFunctional unit / ESL:1 m installed insulation material,packaging included, with thicknessthat gives average thermal resistanceof R = 1m ·K/W over an estimatedservice life (ESL) of 75 yearsLCIA methodology: TRACI 2.1LCA software; LCI databaseLCA for Experts v10.7; LCA for Experts2023In accordance with ISO 14044 and thereference PCR, this life cycleassessment was conducted bySustainable Minds and verified byHarmony Environmental, LLC.Public LCA:Knauf Insulation North America andManson Insulation Products SM Transparency Report (EPD) ™ + Material Health Overview ™EPDLCA3rd-party verifiedTransparency Report (EPD)3rd-party verifiedMATERIAL HEALTHMaterialevaluationSelf-declared2SI 2© 2023 | The SM Transparency Report [EPD]™ Program is operated by Sustainable Minds® (www.sustainableminds.com) | Privacy policyKnauf Insulation, Inc.One Knauf DriveShelbyville, IN 46176www.knaufinsulation.us317 398 4434Contact usShasta Lake, CA

SM Transparency Catalog Knauf Insulation Showroom Jet Stream® Ultra Blowing Wool Insulation PERFORMANCE DASHBOARDLCA & MATERIAL RESULTS & INTERPRETATIONHOW WE MAKE IT GREENERJet Stream® Ultra Blowing Wool InsulationScope and summaryCradle to gate Cradle to gate with options Cradle to graveApplicationAt the installation site, loose fill is installed using a blowing wool machine andblown into open attics or closed cavities. It can be used to dense-packsidewalls using the drill and fill technique common in retrofitting homes or inhome weatherization activities.Functional unitOne square meter of installed insulation material, packaging included, with athickness that gives an average thermal resistance of R = 1m ·K/W with abuilding service life of 75 years.Reference service life: 75 years when installed per manufacturer’s instructionsReference flow: 0.176 kg of product, at a thickness of 0.0664 m to achieve thefunctional unit. (ASTM C518)Manufacturing dataReporting period: January 2022 – December 2022Location: Shelbyville, INDefault installation, packaging, and disposal scenariosAt the installation site, insulation products are unpackaged and installed. Forloose fill products, an insulation blower or sprayer is typically used to install theproduct. The potential impact of the blower/sprayer is assumed to be negligiblesince its use is spread out over hundreds of bags of product; therefore, it wasnot included in the model.No material is assumed to be lost or wasted. Scraps are typically used to fillcorners or crevices. Plastic packaging waste is disposed (9% to recycling, 68%to landfill, and 17% to incineration), paper-based packaging waste is disposed(68% to recycling, 20% to landfill, and 5% to incineration), and no maintenanceor replacement is required over the life of the building. After removal, theinsulation is assumed to be landfilled. Insulation and packaging waste areassumed to be transported 100 miles for disposal.What’s causing the greatest impactsAll life cycle stagesThe manufacturing stage dominates all impact categories except ozonedepletion, where the raw material acquisition stage takes precedence. Theenergy required to melt the glass and produce the glass fibers is the largestcontributor to the manufacturing stage. The impact of the raw materialacquisition stage is mostly due to the batch materials. The contributions tooutbound transportation are caused by the use of trucks and rail transport.The only impacts associated with installation and maintenance are due to thedisposal of packaging waste, which is the smallest contributor of all thestages. At the end of life, insulation is manually removed from the buildingand landfilled. For all products, waste is dominated by the final disposal of theproduct. Non-hazardous waste accounts for waste generated duringmanufacturing and installation.Raw materials acquisition and transportationThe raw material acquisition stage is the second highest contributor formost impact categories, but ozone depletion potential is almost entirelygenerated from this stage. The raw materials acquisition stage impact islargely due to the borax, manganese oxide, and soda ash in the batch. Third-party verified ISO 14040/44 secondary LCI data sets contribute more than80% of the total impacts to ozone depletion.Manufacturing stageThe manufacturing stage has the most significant contribution to all impactcategories, primarily due to the energy required to melt the glass andproduce the glass fibers. Since some batch ingredients significantlycontribute to the respiratory effects category, they can lead to higher impactresults in the raw materials acquisition stage. However, since sand and boraxare melted in the oven with the other batch materials, they are not releasedinto the air as fine particulates. Therefore, the calculated potential impacts asshown in the results tables are likely much larger than the actual impacts inthe raw material acquisition stage. This implies that the manufacturing stagemay have a greater share of the impact than what is displayed in the totalimpacts by life cycle stage.DistributionOutbound transportation is the third highest contributor to smog impacts.End of lifeThe end-of-life impacts are largely due to landfilling of the product after it hasbeen removed from the building and transported to a landfill. Since materialsare assumed to be landfilled at the end of life rather than incinerated orreused/recycled, no materials are available for energy recovery orreuse/recycling.Embodied carbonEmbodied carbon can be defined as the cradle-to-gate (A1-A3) globalwarming potential impacts. The total embodied carbon per functional unit ofloose fill insulation manufactured in Albion, MI is 4.09E-01 kg CO -eq perfunctional unit.How we're making it greenerKnauf Insulation North America (KINA) is committed to providingproducts that conserve energy and preserve natural resources.Our fiberglass contains on average over 60% recycled glass, whichrequires about 20% less energy required to form glass fibers, andresults in about 25% reduction in embodied carbon.Our glass is audited by a 3rd party to ensure biosoluble chemistry froma health and safety standpoint.See how we make it greenerReferencesLCA Background ReportKnauf Insulation North America and Manson Insulation Products LCABackground Report (public version), Knauf Insulation North America (KINA)2023; developed using the TRACI v2.1 and CML impact assessmentmethodologies, and LCA for Experts modeling software.ISO 14025, “Sustainability in buildings and civil engineering works -- Corerules for environmental product declarations of construction products andservices”ISO 21930:2017 serves as the core PCR along with UL Part A.UL Part A: Life Cycle Assessment Calculation Rules and ReportRequirements v4.0March, 2022. PCR review conducted by Lindita Bushi, PhD, Chair (AthenaSustainable Materials Institute), lindita.bushi@athenasmi.org; Hugues Imbeault-Tétreault (Group AGECO); and Jack Geibig (Ecoform).UL Part B: Building Envelope Thermal Insulation EPD Requirements, v2.0April, 2018. PCR review conducted by Thomas Gloria, PhD, Chair (IndustrialEcology Consultants) t.gloria@industrial-ecology.com; Christoph Koffler, PhD(thinkstep); Andre Desjarlais (Oak Ridge National Laboratory).UL Environment General Program Instructions v2.4, July 2018 (availableupon request)Download PDF SM Transparency Report / EPDSM Transparency Reports (TR) are ISO 14025 Type III environmental declarations (EPD) thatenable purchasers and users to compare the potential environmental performance of productson a life cycle basis. Environmental declarations from different programs (ISO 14025) may not becomparable. Comparison of the environmental performance of products using EPD informationshall be based on the product’s use and impacts at the building level, and therefore EPDs may notbe used for comparability purposes when not considering the building energy use phase asinstructed under this PCR. Full conformance with the PCR for Building Envelope ThermalInsulation allows EPD comparability only when all stages of a life cycle have been considered.However, variations and deviations are possible. Example of variations: Different LCA softwareand background LCI datasets may lead to differences results for upstream or downstream of thelife cycle stages declared.Rating systemsThe intent is to reward project teams for selecting products frommanufacturers who have verified improved life-cycle environmentalperformance.LEED BD+C: New Construction | v4 - LEED v4Building product disclosure and optimizationEnvironmental product declarations½productIndustry-wide (generic) EPD1 productProduct-specific Type III EPDLEED BD+C: New Construction | v4.1 - LEED v4.1Building product disclosure and optimizationEnvironmental product declarations1 productIndustry-wide (generic) EPD1.5 productProduct-specific Type III EPDCollaborative for High Performance Schools NationalCriteriaMW C5.1 – Environmental Product Declarations2 pointThird-party certified type III EPDGreen Globes for New Construction and SustainableInteriorsMaterials and resourcesNC 3.5.1.2 Path B: Prescriptive Path for Building Core and ShellNC 3.5.2.2 and SI 4.1.2 Path B: Prescriptive Path for Interior Fit-outsBREEAM New Construction 2018Mat 02 - Environmental impacts from construction productsEnvironmental Product Declarations (EPD).5 pointIndustry-average EPD.75 pointsMulti-product specific EPD1 pointProduct-specific EPDLCA results & interpretationLCA resultsLIFE CYCLE STAGERAW MATERIALACQUISITIONMANUFACTURINGTRANSPORTATIONINSTALLATIONANDMAINTENANCEDISPOSAL/ REUSE/RECYCLINGInformation modules:Included (X) | Excluded (MND)**Module D is also excluded from thissystem boundary (MND).(X) A1 Rawmaterials(X) A3Manufacturing(X) A4 Distribution(X) A5 Installation(X) C1Deconstruction(X) A2Transportation (X) B1 Use(X) C2Transportation (X) B2 Maintenance(X) C3 Wasteprocessing (X) B3 Repair(X) C4 Disposal (X) B4 Replacement (X) B5Refurbishment (X) B6 Operationalenergy use (X) B7 Operationalwater use SM Single Score Learn about SM Single Score resultsImpacts per 1 square meter ofinsulation material1.31E-03 mPts3.03E-03 mPts9.57E-05 mPts6.86E-06 mPts1.32E-04 mPtsMaterials or processes contributing >20%to total impacts in each life cycle stageBatch materialproduction.Energy required tomelt the glass andproduce the glassfibers.Truck and railtransportation usedto transport productto building site.Transportation tolandfill andlandfilling ofpackaging materials.Transportation tolandfill andlandfilling of productat end of life.TRACI v2.1 results per functional unit (Jet Stream® - Shelbyville, IN)LIFE CYCLE STAGERAW MATERIALACQUISITIONMANUFACTURINGTRANSPORTATIONINSTALLATIONANDMAINTENANCEDISPOSAL/ REUSE/RECYCLINGEcological damageImpact categoryUnitGlobal warmingkg CO eq5.84E-023.51E-015.17E-031.34E-036.40E-03Ozone depletionkg CFC-11 eq3.62E-133.81E-141.15E-171.33E-171.84E-16Acidificationkg SO eq2.40E-045.64E-042.65E-057.94E-072.68E-05Eutrophicationkg N eq2.60E-051.43E-042.27E-063.69E-071.65E-06Human health damageImpact categoryUnitSmogkg O eq2.51E-031.07E-029.09E-041.04E-055.24E-04Respiratory effectskg PM eq1.91E-053.05E-051.30E-063.93E-081.81E-06Additional environmental informationImpact categoryUnitCarcinogenicsCTU3.9%93.3%0.2%0.0%2.5%Non-carcinogenicsCTU9.5%83.7%0.4%0.1%6.2%EcotoxicityCTU5.5%92.7%0.9%0.0%0.9%Fossil fuel depletionMJ surplus8.95E-024.90E-019.69E-033.23E-041.25E-02 Albion, MILanett, ALShasta Lake, CAEPD additional contentMaterial healthSI 222232.5hheValidity: 12/12/23 – 12/12/28KNA – 12122023 – 003This environmental productdeclaration (EPD) was externallyverified by Harmony Environmental,LLC, according to ISO 21930:2017;UL Part A; UL Part B for BuildingEnvelope Thermal InsulationProducts; and ISO 14025:2006.Harmony Environmental, LLC16362 W. Briarwood Ct.Olathe, KS 66062www.harmonyenviro.com(913) 780-3328SUMMARYReference PCRUL Part B: Building Envelope ThermalInsulation v2.0Regions; system boundariesNorth America; Cradle-to-graveFunctional unit / ESL:1 m installed insulation material,packaging included, with thicknessthat gives average thermal resistanceof R = 1m ·K/W over an estimatedservice life (ESL) of 75 yearsLCIA methodology: TRACI 2.1LCA software; LCI databaseLCA for Experts v10.7; LCA for Experts2023In accordance with ISO 14044 and thereference PCR, this life cycleassessment was conducted bySustainable Minds and verified byHarmony Environmental, LLC.Public LCA:Knauf Insulation North America andManson Insulation Products SM Transparency Report (EPD) ™ + Material Health Overview ™EPDLCA3rd-party verifiedTransparency Report (EPD)3rd-party verifiedMATERIAL HEALTHMaterialevaluationSelf-declared2SI 2© 2023 | The SM Transparency Report [EPD]™ Program is operated by Sustainable Minds® (www.sustainableminds.com) | Privacy policyKnauf Insulation, Inc.One Knauf DriveShelbyville, IN 46176www.knaufinsulation.us317 398 4434Contact usShelbyville, IN
SM Transparency Catalog Knauf Insulation Showroom Jet Stream® Ultra Blowing Wool Insulation PERFORMANCE DASHBOARDLCA & MATERIAL RESULTS & INTERPRETATIONHOW WE MAKE IT GREENERJet Stream® Ultra Blowing Wool InsulationDataBackground This product-specific plant-specific declaration was created bycollecting production data from the Albion, MI; Lanett, AL; Shasta Lake, CA; andShelbyville, IN production locations. Secondary data sources include thoseavailable in LCA for Experts 2023 databases.Allocation The PCR prescribes where and how allocation occurs. Since onlyfacility-level data were available, allocation among the facilities' other co-products was necessary to determine the input and output flows associatedwith the product. Allocation of batch materials and energy was done on aproduct output mass basis, binder materials were allocated based on the masscalculated from the bill of materials and binder formulations, facers wereallocated based on product area, and packaging was allocated based on massper package of product. Allocation of transportation was based on eitherweight or volume, depending on which was found to restrict the amount ofcargo; the limiting factor was used in allocating transportation.Cut-off criteria for the inclusion of mass and energy flows are 1% of renewableprimary resource (energy) usage, 1% nonrenewable primary resource (energy)usage, 1% of the total mass input of that unit process, and 1% of environmentalimpacts. The total of neglected input flows per module does not exceed 5% ofenergy usage, mass, and environmental impacts. The only exceptions to thesecriteria are substances with hazardous and toxic properties, which must belisted even when the given process unit is under the cut-off criterion of 1% ofthe total mass. No known flows are deliberately excluded from this declaration;therefore, these criteria have been met. Biogenic carbon is included in reportedresults.Quality Temporal and technological representativeness are considered to behigh. Geographical representativeness is considered to be high. All relevantprocess steps for the product system were considered and modeled. Theprocess chain is considered sufficiently complete with regards to the goal andscope of this study. The product system was checked for mass balance andcompleteness of the inventory. Capital goods were excluded since they areassumed not to significantly affect the conclusions of the LCA. Otherwise, nodata were knowingly omitted. For more information on data quality, see the LCAbackground report.LCIA impact factors required by the PCR are global warming, ozone depletion,acidification, eutrophication, smog, and fossil fuel depletion; “These six impactcategories are globally deemed mature enough to be included in Type IIIenvironmental declarations. Other categories are being developed and definedand LCA should continue making advances in their development. However, theEPD users shall not use additional measures for comparative purposes.”Flow diagramScenarios and additional technical informationPARAMETERVALUEUNITTransport to the building site [A4]Vehicle typeTruck and trailer-Fuel typeDiesel-Average distance frommanufacturing to installation site161kmCapacity utilization27%Gross density28.8kg/m³Capacity utilization volume factor1-Installation into the building [A5]Mass of plastic packaging waste0.00271kgBiogenic carbon content ofpackaging0kg COEnd of life [C1-C4]Assumptions for scenariodevelopmentFollowing manual removal of theinsulation, it was assumed to betransported 100 miles to disposal.The PCR prescribes that 100% ofthe insulation is sent to landfill,where no prior waste processing isrequired.Collection processCollected with mixedconstruction waste0.173 kgDisposalProduct for finaldeposition in landfill0.173 kgTechnical propertiesDimensions/quantities delivered toinstallation siteJet Stream® is sold in bags. Onemaster bag contains 42 plasticbags, and each bag weighs 32pounds.ASTM or ANSI productspecificationASTM C764; Type ICorrosionASTM C764; PassCombustibilityASTM E136; Non-combustibleWater vapor sorption (by weight)ASTM C1104; Less than 5%Critical radiant fluxASTM E970; Greater than 0.12W/cm²Mold growthASTM C1338; PassSurface burning characteristics(flame spread/smoke developed)ASTM E84, CAN 4-S102.2; 25/50Major system boundary exclusionsCapital goods and infrastructure; maintenance of operation and supportequipment;Manufacture & transport of packaging materials not associated with finalproduct;Human labor and employee transport;Building operational energy and water use not associated with finalproduct.Major assumptions and limitationsDue to the nature of fiberglass insulation, it is anticipated that it will last forthe lifetime of the building, so the reference service life (RSL) is consideredto be the same as the building estimated service life (ESL) of 75 years.Generic data sets used for material inputs, transport, and waste processingare considered good quality, but actual impacts from material suppliers,transport carriers, and local waste processing may vary.The impact assessment methodology categories do not represent allpossible environmental impact categories.Characterization factors used within the impact assessment methodologymay contain varying levels of uncertainty.LCA results are relative expressions and do not predict impacts oncategory endpoints, the exceeding of thresholds, safety margins or risks.EPD additional contentJet Stream® Ultra Blowing Wool Insulation produced in Albion, MI: LCIA results, resource use, output and waste flows, and carbonemissions & removals per functional unitParameterUnitA1-A3A4A5B1-B7C1C2C3C4TotalLCIA resultsGlobal warmingkg CO eq3.28E-015.17E-031.34E-03002.78E-0303.62E-033.41E-01Ozone depletionkg CFC-11 eq1.21E-111.15E-171.33E-17006.21E-1801.78E-161.21E-11Acidificationkg SO2 eq6.60E-042.65E-057.94E-07007.61E-0601.92E-057.14E-04Eutrophicationkg N eq1.37E-042.27E-063.69E-07008.06E-0708.43E-071.42E-04Smogkg O eq9.67E-039.09E-041.04E-05001.74E-0403.50E-041.11E-02Respiratory effectskg PM2.5 eq4.31E-051.30E-063.93E-08003.26E-0701.48E-064.63E-05Additional environmental informationCarcinogenicsCTUh96.4%0.3%0.1%0%0%0.2%0%3.1%100%Non-carcinogenicsCTUh91.3%0.5%0.2%0%0%0.3%0%7.7%100%EcotoxicityCTUe97.7%1.1%0.1%0%0%0.6%0%0.6%100%Fossil fuel depletionMJ surplus4.86E-019.69E-033.23E-04005.21E-0307.30E-035.08E-01Resource use indicatorsRenewable primary energy used asenergy carrier (fuel)MJ, LHV1.05E+002.85E-035.36E-04001.53E-0306.79E-031.06E+00Renewable primary resources withenergy content used as materialMJ, LHV8.68E-09-2.36E-131.26E-1300-1.27E-1301.35E-128.68E-09Non-renewable primary resourcesused as an energy carrier (fuel)MJ, LHV5.20E+007.32E-023.51E-03003.94E-0205.80E-025.38E+00Non-renewable primary resourceswith energy content used asmaterialMJ, LHV1.27E-082.92E-108.61E-12001.57E-1001.45E-101.33E-08Secondary materialskg1.11E-010.00E+000.00E+00000.00E+0000.00E+001.11E-01Renewable secondary fuelsMJ, LHV0.00E+000.00E+000.00E+00000.00E+0000.00E+000.00E+00Non-renewable secondary fuelsMJ, LHV0.00E+000.00E+000.00E+00000.00E+0000.00E+000.00E+00Recovered energyMJ, LHV0.00E+000.00E+000.00E+00000.00E+0000.00E+000.00E+00Use of net fresh water resourcesm9.43E-029.90E-062.95E-06005.33E-0607.19E-069.44E-02Abiotic depletion potential, fossilMJ, LHV4.54E+007.27E-022.98E-03003.91E-0205.62E-024.71E+00Output flows and waste category indicatorsHazardous waste disposedkg0.00E+000.00E+000.00E+00000.00E+0000.00E+000.00E+00Non-hazardous waste disposedkg1.52E-030.00E+001.84E-03000.00E+0001.73E-011.77E-01High-level radioactive wastekg2.29E-072.13E-102.22E-10001.15E-1007.17E-102.30E-07Intermediate- and low-levelradioactive waste, conditioned, tofinal repositorykg2.36E-041.80E-071.87E-07009.66E-0806.41E-072.37E-04Components for re-usekg0.00E+000.00E+000.00E+00000.00E+0000.00E+000.00E+00Materials for recyclingkg0.00E+000.00E+004.06E-04000.00E+0000.00E+004.06E-04Materials for energy recoverykg0.00E+000.00E+000.00E+00000.00E+0000.00E+000.00E+00Exported energyMJ, LHV0.00E+000.00E+000.00E+00000.00E+0000.00E+000.00E+00Carbon emissions and removalsBiogenic carbon removal fromproductkg CO2.62E-020.00E+000.00E+00000.00E+0000.00E+002.62E-02Biogenic carbon emission fromproductkg CO2.83E-020.00E+000.00E+00000.00E+0002.98E-042.86E-02Biogenic carbon removal frompackagingkg CO0.00E+000.00E+000.00E+00000.00E+0000.00E+000.00E+00Biogenic carbon emission frompackagingkg CO0.00E+000.00E+000.00E+00000.00E+0000.00E+000.00E+00Biogenic carbon emission fromcombustion of wastekg CO0.00E+000.00E+000.00E+00000.00E+0000.00E+000.00E+00Calcination carbon emissionskg CO0.00E+000.00E+000.00E+00000.00E+0000.00E+000.00E+00Carbonation carbon removalskg CO0.00E+000.00E+000.00E+00000.00E+0000.00E+000.00E+00Carbon emissions from combustionof waste from renewable sourcesused in production processes+Carbon emissions from combustionof waste from non renewablesources used in productionprocesseskg CO0.00E+000.00E+000.00E+00000.00E+0000.00E+000.00E+00Jet Stream® Ultra Blowing Wool Insulation produced in Lanett, AL: LCIA results, resource use, output and waste flows, and carbonemissions & removals per functional unitParameterUnitA1-A3A4A5B1-B7C1C2C3C4TotalLCIA resultsGlobal warmingkg CO eq4.08E-015.17E-031.34E-03002.78E-0303.62E-034.21E-01Ozone depletionkg CFC-11 eq3.91E-141.15E-171.33E-17006.21E-1801.78E-163.93E-14Acidificationkg SO2 eq8.73E-042.65E-057.94E-07007.61E-0601.92E-059.28E-04Eutrophicationkg N eq1.72E-042.27E-063.69E-07008.06E-0708.43E-071.76E-04Smogkg O eq1.42E-029.09E-041.04E-05001.74E-0403.50E-041.56E-02Respiratory effectskg PM2.5 eq5.37E-051.30E-063.93E-08003.26E-0701.48E-065.68E-05Additional environmental informationCarcinogenicsCTUh97.0%0.2%0.0%0%0%0.1%0%2.6%100%Non-carcinogenicsCTUh93.0%0.4%0.1%0%0%0.2%0%6.2%100%EcotoxicityCTUe98.1%0.9%0.1%0%0%0.5%0%0.5%100%Fossil fuel depletionMJ surplus6.71E-019.69E-033.23E-04005.21E-0307.30E-036.93E-01Resource use indicatorsRenewable primary energy used asenergy carrier (fuel)MJ, LHV1.11E+002.85E-035.36E-04001.53E-0306.79E-031.12E+00Renewable primary resources withenergy content used as materialMJ, LHV2.95E-10-2.36E-131.26E-1300-1.27E-1301.35E-122.97E-10Non-renewable primary resourcesused as an energy carrier (fuel)MJ, LHV6.45E+007.32E-023.51E-03003.94E-0205.80E-026.63E+00Non-renewable primary resourceswith energy content used asmaterialMJ, LHV1.70E-082.92E-108.61E-12001.57E-1001.45E-101.76E-08Secondary materialskg5.89E-020.00E+000.00E+00000.00E+0000.00E+005.89E-02Renewable secondary fuelsMJ, LHV0.00E+000.00E+000.00E+00000.00E+0000.00E+000.00E+00Non-renewable secondary fuelsMJ, LHV0.00E+000.00E+000.00E+00000.00E+0000.00E+000.00E+00Recovered energyMJ, LHV0.00E+000.00E+000.00E+00000.00E+0000.00E+000.00E+00Use of net fresh water resourcesm1.13E-019.90E-062.95E-06005.33E-0607.19E-061.13E-01Abiotic depletion potential, fossilMJ, LHV5.65E+007.27E-022.98E-03003.91E-0205.62E-025.82E+00Output flows and waste category indicatorsHazardous waste disposedkg0.00E+000.00E+000.00E+00000.00E+0000.00E+000.00E+00Non-hazardous waste disposedkg2.70E-020.00E+001.84E-03000.00E+0001.73E-012.02E-01High-level radioactive wastekg2.77E-072.13E-102.22E-10001.15E-1007.17E-102.78E-07Intermediate- and low-levelradioactive waste, conditioned, tofinal repositorykg2.85E-041.80E-071.87E-07009.66E-0806.41E-072.86E-04Components for re-usekg0.00E+000.00E+000.00E+00000.00E+0000.00E+000.00E+00Materials for recyclingkg0.00E+000.00E+004.06E-04000.00E+0000.00E+004.06E-04Materials for energy recoverykg0.00E+000.00E+000.00E+00000.00E+0000.00E+000.00E+00Exported energyMJ, LHV0.00E+000.00E+000.00E+00000.00E+0000.00E+000.00E+00Carbon emissions and removalsBiogenic carbon removal fromproductkg CO3.02E-020.00E+000.00E+00000.00E+0000.00E+003.02E-02Biogenic carbon emission fromproductkg CO3.27E-020.00E+000.00E+00000.00E+0002.98E-043.30E-02Biogenic carbon removal frompackagingkg CO0.00E+000.00E+000.00E+00000.00E+0000.00E+000.00E+00Biogenic carbon emission frompackagingkg CO0.00E+000.00E+000.00E+00000.00E+0000.00E+000.00E+00Biogenic carbon emission fromcombustion of wastekg CO0.00E+000.00E+000.00E+00000.00E+0000.00E+000.00E+00Calcination carbon emissionskg CO0.00E+000.00E+000.00E+00000.00E+0000.00E+000.00E+00Carbonation carbon removalskg CO0.00E+000.00E+000.00E+00000.00E+0000.00E+000.00E+00Carbon emissions from combustionof waste from renewable sourcesused in production processes+Carbon emissions from combustionof waste from non renewablesources used in productionprocesseskg CO0.00E+000.00E+000.00E+00000.00E+0000.00E+000.00E+00Jet Stream® Ultra Blowing Wool Insulation produced in Shasta Lake, CA: LCIA results, resource use, output and waste flows, andcarbon emissions & removals per functional unitParameterUnitA1-A3A4A5B1-B7C1C2C3C4TotalLCIA resultsGlobal warmingkg CO eq3.62E-015.17E-031.34E-03002.78E-0303.62E-033.75E-01Ozone depletionkg CFC-11 eq3.03E-131.15E-171.33E-17006.21E-1801.78E-163.03E-13Acidificationkg SO2 eq7.94E-042.65E-057.94E-07007.61E-0601.92E-058.48E-04Eutrophicationkg N eq1.49E-042.27E-063.69E-07008.06E-0708.43E-071.53E-04Smogkg O eq1.12E-029.09E-041.04E-05001.74E-0403.50E-041.26E-02Respiratory effectskg PM2.5 eq4.02E-051.30E-063.93E-08003.26E-0701.48E-064.34E-05Additional environmental informationCarcinogenicsCTUh97.5%0.2%0.0%0%0%0.1%0%2.2%100%Non-carcinogenicsCTUh95.2%0.3%0.1%0%0%0.2%0%4.3%100%EcotoxicityCTUe98.4%0.8%0.0%0%0%0.4%0%0.4%100%Fossil fuel depletionMJ surplus8.09E-019.69E-033.23E-04005.21E-0307.30E-038.32E-01Resource use indicatorsRenewable primary energy used asenergy carrier (fuel)MJ, LHV1.98E+002.85E-035.36E-04001.53E-0306.79E-031.99E+00Renewable primary resources withenergy content used as materialMJ, LHV1.06E-08-2.36E-131.26E-1300-1.27E-1301.35E-121.06E-08Non-renewable primary resourcesused as an energy carrier (fuel)MJ, LHV7.25E+007.32E-023.51E-03003.94E-0205.80E-027.43E+00Non-renewable primary resourceswith energy content used asmaterialMJ, LHV2.58E-082.92E-108.61E-12001.57E-1001.45E-102.64E-08Secondary materialskg9.97E-020.00E+000.00E+00000.00E+0000.00E+009.97E-02Renewable secondary fuelsMJ, LHV0.00E+000.00E+000.00E+00000.00E+0000.00E+000.00E+00Non-renewable secondary fuelsMJ, LHV0.00E+000.00E+000.00E+00000.00E+0000.00E+000.00E+00Recovered energyMJ, LHV0.00E+000.00E+000.00E+00000.00E+0000.00E+000.00E+00Use of net fresh water resourcesm1.06E-019.90E-062.95E-06005.33E-0607.19E-061.06E-01Abiotic depletion potential, fossilMJ, LHV6.50E+007.27E-022.98E-03003.91E-0205.62E-026.67E+00Output flows and waste category indicatorsHazardous waste disposedkg0.00E+000.00E+000.00E+00000.00E+0000.00E+000.00E+00Non-hazardous waste disposedkg4.80E-030.00E+001.84E-03000.00E+0001.73E-011.80E-01High-level radioactive wastekg2.58E-072.13E-102.22E-10001.15E-1007.17E-102.59E-07Intermediate- and low-levelradioactive waste, conditioned, tofinal repositorykg2.66E-041.80E-071.87E-07009.66E-0806.41E-072.67E-04Components for re-usekg0.00E+000.00E+000.00E+00000.00E+0000.00E+000.00E+00Materials for recyclingkg0.00E+000.00E+004.06E-04000.00E+0000.00E+004.06E-04Materials for energy recoverykg0.00E+000.00E+000.00E+00000.00E+0000.00E+000.00E+00Exported energyMJ, LHV0.00E+000.00E+000.00E+00000.00E+0000.00E+000.00E+00Carbon emissions and removalsBiogenic carbon removal fromproductkg CO3.08E-020.00E+000.00E+00000.00E+0000.00E+003.08E-02Biogenic carbon emission fromproductkg CO3.31E-020.00E+000.00E+00000.00E+0002.98E-043.34E-02Biogenic carbon removal frompackagingkg CO0.00E+000.00E+000.00E+00000.00E+0000.00E+000.00E+00Biogenic carbon emission frompackagingkg CO0.00E+000.00E+000.00E+00000.00E+0000.00E+000.00E+00Biogenic carbon emission fromcombustion of wastekg CO0.00E+000.00E+000.00E+00000.00E+0000.00E+000.00E+00Calcination carbon emissionskg CO0.00E+000.00E+000.00E+00000.00E+0000.00E+000.00E+00Carbonation carbon removalskg CO0.00E+000.00E+000.00E+00000.00E+0000.00E+000.00E+00Carbon emissions from combustionof waste from renewable sourcesused in production processes+Carbon emissions from combustionof waste from non renewablesources used in productionprocesseskg CO0.00E+000.00E+000.00E+00000.00E+0000.00E+000.00E+00Jet Stream® Ultra Blowing Wool Insulation produced in Shelbyville, IN: LCIA results, resource use, output and waste flows, andcarbon emissions & removals per functional unitParameterUnitA1-A3A4A5B1-B7C1C2C3C4TotalLCIA resultsGlobal warmingkg CO eq4.09E-015.17E-031.34E-03002.78E-0303.62E-034.22E-01Ozone depletionkg CFC-11 eq4.00E-131.15E-171.33E-17006.21E-1801.78E-164.00E-13Acidificationkg SO2 eq8.05E-042.65E-057.94E-07007.61E-0601.92E-058.59E-04Eutrophicationkg N eq1.69E-042.27E-063.69E-07008.06E-0708.43E-071.74E-04Smogkg O eq1.32E-029.09E-041.04E-05001.74E-0403.50E-041.47E-02Respiratory effectskg PM2.5 eq4.96E-051.30E-063.93E-08003.26E-0701.48E-065.28E-05Additional environmental informationCarcinogenicsCTUh97.2%0.2%0.0%0%0%0.1%0%2.4%100%Non-carcinogenicsCTUh93.3%0.4%0.1%0%0%0.2%0%6.0%100%EcotoxicityCTUe98.2%0.9%0.0%0%0%0.5%0%0.4%100%Fossil fuel depletionMJ surplus5.80E-019.69E-033.23E-04005.21E-0307.30E-036.02E-01Resource use indicatorsRenewable primary energy used asenergy carrier (fuel)MJ, LHV1.26E+002.85E-035.36E-04001.53E-0306.79E-031.27E+00Renewable primary resources withenergy content used as materialMJ, LHV1.71E-08-2.36E-131.26E-1300-1.27E-1301.35E-121.71E-08Non-renewable primary resourcesused as an energy carrier (fuel)MJ, LHV7.01E+007.32E-023.51E-03003.94E-0205.80E-027.19E+00Non-renewable primary resourceswith energy content used asmaterialMJ, LHV1.49E-082.92E-108.61E-12001.57E-1001.45E-101.55E-08Secondary materialskg1.04E-010.00E+000.00E+00000.00E+0000.00E+001.04E-01Renewable secondary fuelsMJ, LHV0.00E+000.00E+000.00E+00000.00E+0000.00E+000.00E+00Non-renewable secondary fuelsMJ, LHV0.00E+000.00E+000.00E+00000.00E+0000.00E+000.00E+00Recovered energyMJ, LHV0.00E+000.00E+000.00E+00000.00E+0000.00E+000.00E+00Use of net fresh water resourcesm1.23E-019.90E-062.95E-06005.33E-0607.19E-061.23E-01Abiotic depletion potential, fossilMJ, LHV5.56E+007.27E-022.98E-03003.91E-0205.62E-025.73E+00Output flows and waste category indicatorsHazardous waste disposedkg0.00E+000.00E+000.00E+00000.00E+0000.00E+000.00E+00Non-hazardous waste disposedkg2.72E-020.00E+001.84E-03000.00E+0001.73E-012.02E-01High-level radioactive wastekg5.48E-072.13E-102.22E-10001.15E-1007.17E-105.49E-07Intermediate- and low-levelradioactive waste, conditioned, tofinal repositorykg5.15E-041.80E-071.87E-07009.66E-0806.41E-075.17E-04Components for re-usekg0.00E+000.00E+000.00E+00000.00E+0000.00E+000.00E+00Materials for recyclingkg0.00E+000.00E+004.06E-04000.00E+0000.00E+004.06E-04Materials for energy recoverykg0.00E+000.00E+000.00E+00000.00E+0000.00E+000.00E+00Exported energyMJ, LHV0.00E+000.00E+000.00E+00000.00E+0000.00E+000.00E+00Carbon emissions and removalsBiogenic carbon removal fromproductkg CO2.95E-020.00E+000.00E+00000.00E+0000.00E+002.95E-02Biogenic carbon emission fromproductkg CO3.23E-020.00E+000.00E+00000.00E+0002.98E-043.26E-02Biogenic carbon removal frompackagingkg CO0.00E+000.00E+000.00E+00000.00E+0000.00E+000.00E+00Biogenic carbon emission frompackagingkg CO0.00E+000.00E+000.00E+00000.00E+0000.00E+000.00E+00Biogenic carbon emission fromcombustion of wastekg CO0.00E+000.00E+000.00E+00000.00E+0000.00E+000.00E+00Calcination carbon emissionskg CO0.00E+000.00E+000.00E+00000.00E+0000.00E+000.00E+00Carbonation carbon removalskg CO0.00E+000.00E+000.00E+00000.00E+0000.00E+000.00E+00Carbon emissions from combustionof waste from renewable sourcesused in production processes+Carbon emissions from combustionof waste from non renewablesources used in productionprocesseskg CO0.00E+000.00E+000.00E+00000.00E+0000.00E+000.00E+00 Albion, MILanett, ALShasta Lake, CAShelbyville, INMaterial health22 3 3222222222 3 3222222222 3 3222222222 3 322222222Validity: 12/12/23 – 12/12/28KNA – 12122023 – 003This environmental productdeclaration (EPD) was externallyverified by Harmony Environmental,LLC, according to ISO 21930:2017;UL Part A; UL Part B for BuildingEnvelope Thermal InsulationProducts; and ISO 14025:2006.Harmony Environmental, LLC16362 W. Briarwood Ct.Olathe, KS 66062www.harmonyenviro.com(913) 780-3328SUMMARYReference PCRUL Part B: Building Envelope ThermalInsulation v2.0Regions; system boundariesNorth America; Cradle-to-graveFunctional unit / ESL:1 m installed insulation material,packaging included, with thicknessthat gives average thermal resistanceof R = 1m ·K/W over an estimatedservice life (ESL) of 75 yearsLCIA methodology: TRACI 2.1LCA software; LCI databaseLCA for Experts v10.7; LCA for Experts2023In accordance with ISO 14044 and thereference PCR, this life cycleassessment was conducted bySustainable Minds and verified byHarmony Environmental, LLC.Public LCA:Knauf Insulation North America andManson Insulation Products SM Transparency Report (EPD) ™ + Material Health Overview ™EPDLCA3rd-party verifiedTransparency Report (EPD)3rd-party verifiedMATERIAL HEALTHMaterialevaluationSelf-declared2SI 2© 2023 | The SM Transparency Report [EPD]™ Program is operated by Sustainable Minds® (www.sustainableminds.com) | Privacy policyKnauf Insulation, Inc.One Knauf DriveShelbyville, IN 46176www.knaufinsulation.us317 398 4434Contact usEPD additional content
SM Transparency Catalog Knauf Insulation Showroom Jet Stream® Ultra Blowing Wool Insulation PERFORMANCE DASHBOARDLCA & MATERIAL RESULTS & INTERPRETATIONHOW WE MAKE IT GREENERJet Stream® Ultra Blowing Wool InsulationDeclare™Inventory threshold: 100 ppmClick the label to see the full declaration.Jet Stream® Ultra loosefill insulationEvaluation programsDeclareDeclare labels are issued to products disclosing ingredient inventory,sourcing and end of life options. Declare labels are based on theManufacturers Guide to Declare, administered by the International Living FutureInstitute.How it worksMaterial ingredients are inventoried and screened against the Living BuildingChallenge (LBC) Red List which represents the ‘worst in class’ materials,chemicals, and elements known to pose serious risks to human health and thegreater ecosystem.Assessment scope and resultsWhat's in this product and whyDeclare levelJet Stream® Ultra contains no Red List chemicals. The Red List is a list ofchemicals that are not allowed in Living Building Challenge buildings. BeingRed List free is our design benchmark at Knauf.Jet Stream Ultra is designed to be blown into walls and attics. This productworks well in interiors, as it is virgin glass with a small amount of lubricant. Theproduct meets GreenGuard Gold criteria and is validated to be formaldehyde-free.The fiber comprising Jet Stream Ultra is 98 – 99% inert virgin glass, with asmall amount of lubricant added. The ingredients in this product avoid the800+ chemicals of the Living Building Challenge Red List. The product isdesignated Red List Free and formaldehyde-free.What's in the product and whyBecause Jet Stream Ultra is designed to be blown into walls and attics, itcontains a small amount of fossil based lubricant (1 – 2%) to facilitateblowing. The remainder of the product is inert virgin glass fiber. Theingredients of Jet Stream Ultra avoid the 800+ chemicals of the LivingBuilding Challenge Red List.This product has a high degree of recycled content, and environmentalmining impacts are reduced approximately 60% by using recycled glassrather than virgin materials. The glass formulations used in Knauf products areaudited for health & safety using the European Certification Board for MineralWool Products (EUCEB) exoneration process.Where it goes at the end of its lifeAt this time, the product is landfilled at end of life. We take extendedproducer responsibility very seriously and have active programs to addressend of life. There is no option other than landfills at this time.How we're making it healthierKnauf Insulation North America (KINA) engages very closely with itsvendors to eliminate and avoid chemicals of concern.We lead the fiberglass industry in the most Red List Free products.Our products are certified for indoor air quality and meet the moststringent emission requirements from UL Environment through theGreenguard certification program.Our products are Certified Formaldehyde Free by UL Environment.See how we make it greenerReferencesDeclareJet Stream® Ultra Blowing Wool InsulationManufacturer's Guide to DeclareA comprehensive guide providing information about the program, theassessment methodology, how to submit material data to obtain a Declare labeland how they are used to meet the Health & Happiness and Materials Petals ofthe Living Building Challenge.Rating systemsLEED BD+C: New Construction | v4 - LEED v4Building product disclosure and optimizationMaterial Ingredients1 product eachCredit value options1. Reporting2. Optimization3. Supply Chain OptimizationLEED BD+C: New Construction | v4.1 - LEED v4.1Materials and resourcesMaterial Ingredients1 product eachCredit value options1. Reporting2. Optimization3. Supply Chain OptimizationLiving Building ChallengeMaterials petals imperatives10. Red List Free12. Responsible Industry13. Living Economy SourcingWELL Building Standard®Air and Mind FeaturesX07 Materials TransparencyX08 Materials OptimizationCollaborative for High Performance Schools NationalCriteriaEQ C7.1 Material Health Disclosures2 pointsPerformance Approach2 pointsPrescriptive ApproachLCA & material health results & interpretation Albion, MILanett, ALShasta Lake, CAShelbyville, INEPD additional contentThe Declare product database and labelare used to select products that meet theLBC's stringent materials requirements,streamlining the materials specificationand certification process.LBC Red List Free LBC Red ListApproved Declared Declare level:Validity: 12/12/23 – 12/12/28KNA – 12122023 – 003This environmental productdeclaration (EPD) was externallyverified by Harmony Environmental,LLC, according to ISO 21930:2017;UL Part A; UL Part B for BuildingEnvelope Thermal InsulationProducts; and ISO 14025:2006.Harmony Environmental, LLC16362 W. Briarwood Ct.Olathe, KS 66062www.harmonyenviro.com(913) 780-3328SUMMARYReference PCRUL Part B: Building Envelope ThermalInsulation v2.0Regions; system boundariesNorth America; Cradle-to-graveFunctional unit / ESL:1 m installed insulation material,packaging included, with thicknessthat gives average thermal resistanceof R = 1m ·K/W over an estimatedservice life (ESL) of 75 yearsLCIA methodology: TRACI 2.1LCA software; LCI databaseLCA for Experts v10.7; LCA for Experts2023In accordance with ISO 14044 and thereference PCR, this life cycleassessment was conducted bySustainable Minds and verified byHarmony Environmental, LLC.Public LCA:Knauf Insulation North America andManson Insulation Products SM Transparency Report (EPD) ™ + Material Health Overview ™EPDLCA3rd-party verifiedTransparency Report (EPD)3rd-party verifiedMATERIAL HEALTHMaterialevaluationSelf-declared2SI 2© 2023 | The SM Transparency Report [EPD]™ Program is operated by Sustainable Minds® (www.sustainableminds.com) | Privacy policyKnauf Insulation, Inc.One Knauf DriveShelbyville, IN 46176www.knaufinsulation.us317 398 4434Contact usMaterial health
SM Transparency Catalog Knauf Insulation Showroom Jet Stream® Ultra Blowing Wool Insulation PERFORMANCE DASHBOARDLCA & MATERIAL RESULTS & INTERPRETATIONHOW WE MAKE IT GREENERJet Stream® Ultra Blowing Wool InsulationHow we make it greenerCollapse allRAW MATERIALS ACQUISITIONMANUFACTURINGTRANSPORTATIONINSTALLATION AND MAINTENANCEDISPOSALUtilize recycled contentBy leveraging recycled content, we reduce the energy required toform glass fibers.We use about 10 railcars of recycled glass per day.Reduce scrap generation and energy consumptionContinuous improvement is the methodology we utilize to engagethe entire Knauf team in our manufacturing excellence andsustainability journey.Knauf Insulation, comprised of Knauf Insulation North America(KINA) and Knauf Insulation Europe, Middle East, Asia, Asia Pacific(KI EMEA & APAC), share an overall global certification for ISO45001 Health & Safety, ISO 14001 Environmental, ISO 50001 Energy,and ISO 9001 Quality through a third-party Certification Body.Our Continuous Improvement Program, with all its tools andsystems associated with it, provide a formal process where we areconstantly monitoring our manufacturing and sustainability KeyPerformance Indicators (KPIs) with an eye towards improvement.This Continuous Improvement centric management system hasproven to be effective in improving our sustainability by reducingscrap generation and energy consumption.Green manufacturing ProcessesRegenerative thermal oxidizers We use regenerative thermaloxidizers (RTO) to capture and recycle much of the energy we useto cure our products. RTO is equipment used for the treatment ofexhaust air. Our ovens exhaust into a ceramic heat exchange mediato capture and reuse the heat in the exhausted air. Therefore, theamount of energy required to cure our product is reducedsubstantially.Leverage compression packagingGlass is a high modulus material, which helps to facilitatecompression packaging. We compress our insulation to fit up to fivetimes more product on every truck, thereby reducing the amount ofdeliveries that need to be made, which saves time and emissionsfrom transportation.Be confident in glass fiber's safetyIn the past, a label regarding the carcinogenic potential ofinsulation made from glass fibers was required on all packaging.Following forty years of research, fiberglass has been exoneratedentirely. Our fiberglass is comprised of fibers that are biosoluble,meaning that the fibers dissolve in the body in a short period oftime and exit the body with normal bodily functions. The scrutinyfiberglass has undergone is now seen as proof of its safety.Meet and exceed green standardsGREENGUARD certified On the forefront of indoor air quality, KnaufInsulation North America had the first GREENGUARD certifiedproduct in 2002. This achievement led us to understand the impactour formaldehyde-free products could have on the indoorenvironment. The formaldehyde-free claim is third party validatedby UL Environment.3rd Party UL Environmental Claim Validation states that KnaufInsulation products manufactured in North America contain anaverage of 61% recycled content, consisting of 20% post-consumerand 41% pre-consumer recycled glass.EUCEB tested Glass fiber is a widely studied building material.All of our processes and formulations are voluntarily third-partyaudited for compliance with the health and safety exonerationcriteria for glass and rock based fiber through the EuropeanCertification Board for Mineral Wool Products (EUCEB)exoneration process. This guarantees the formulations arebiosoluble and pose no health concerns. Having over 35 yearsof research behind its safety, fiberglass products have beenthoroughly evaluated and therefore we believe it is one of thesafest building materials available today.Green building rating systemsOur products offer a vast array of potential credits for major greenbuilding rating systems, including: WELL, LEED v4, InternationalGreen Construction Code, Green Guide for Heath Care, NAHBGreen Building Standard, and more.Visit the green building rating systems page to see all the creditsyou can earn using Manson and Knauf Insulation productsPromote RecyclingBy taking a comprehensive approach of the benefits of recycling,Knauf Insulation North America advocates and promotes localrecycling initiatives as well as actively participates in state and localgovernment policy development. In addition, as a member of theNorth American Insulation Manufacturers Association (NAIMA) andGlass Recycling Coalition (GRC), we encourage regulatory andlegislative initiatives that focus on glass recycling infrastructuredeployment to increase the availability of post-consumer recycledglass.Validity: 12/12/23 – 12/12/28KNA – 12122023 – 003This environmental productdeclaration (EPD) was externallyverified by Harmony Environmental,LLC, according to ISO 21930:2017;UL Part A; UL Part B for BuildingEnvelope Thermal InsulationProducts; and ISO 14025:2006.Harmony Environmental, LLC16362 W. Briarwood Ct.Olathe, KS 66062www.harmonyenviro.com(913) 780-3328SUMMARYReference PCRUL Part B: Building Envelope ThermalInsulation v2.0Regions; system boundariesNorth America; Cradle-to-graveFunctional unit / ESL:1 m installed insulation material,packaging included, with thicknessthat gives average thermal resistanceof R = 1m ·K/W over an estimatedservice life (ESL) of 75 yearsLCIA methodology: TRACI 2.1LCA software; LCI databaseLCA for Experts v10.7; LCA for Experts2023In accordance with ISO 14044 and thereference PCR, this life cycleassessment was conducted bySustainable Minds and verified byHarmony Environmental, LLC.Public LCA:Knauf Insulation North America andManson Insulation Products SM Transparency Report (EPD) ™ + Material Health Overview ™EPDLCA3rd-party verifiedTransparency Report (EPD)3rd-party verifiedMATERIAL HEALTHMaterialevaluationSelf-declared2SI 2© 2023 | The SM Transparency Report [EPD]™ Program is operated by Sustainable Minds® (www.sustainableminds.com) | Privacy policyKnauf Insulation, Inc.One Knauf DriveShelbyville, IN 46176www.knaufinsulation.us317 398 4434Contact us
